Economic Data Revisions: Use Python to Compare What Was Known Then with What Is Known Now
Understand economic data vintages, distinguish observation dates from release dates, compare revisions in Python, and prevent future information from entering historical analysis.
Reviewed October 12, 2026. Sources explain FRED and ALFRED vintage data. Both Python examples use clearly synthetic data and were executed on Python 3.12.14. They do not download live indicators or predict financial markets.
Two analysts prepare a chart of the same economy for the same month. Their numbers differ. One copied the first release into a report when it arrived; the other downloaded the series today. Before deciding that someone made a mistake, check whether they used different versions of the data.
Economic observations can change after publication. The St. Louis Fed's data-revisions primer distinguishes updates based on more complete information, error corrections, and broader methodological changes. A later value may improve the description of the economy, but it cannot be treated as information that an earlier decision-maker already possessed.
That distinction is increasingly useful as Python makes it easy to download a historical series and backtest a rule. A clean dataset can still answer the wrong historical question. To study a past decision honestly, preserve the version of the data that was available at that time.
Every observation has more than one date
The observation date identifies the period being measured, such as January employment or second-quarter output. A release date identifies when a published estimate becomes available. A vintage is the version of a series available at a specified point in time. These dates can differ by weeks or months, and later publications can change older observations.
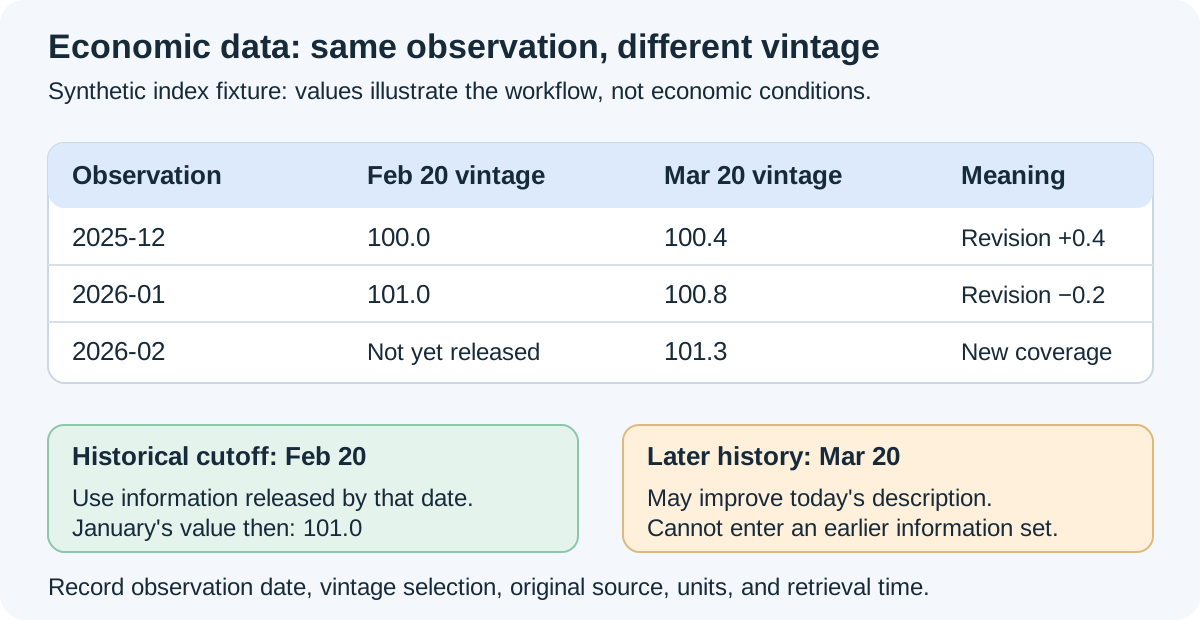
For example, a synthetic January estimate might first appear in February and change in March. Writing 2026-01-01 next to its latest value does not show that the value was available on January 1. The label describes the observation period, not the information date. This is the small distinction that prevents a large historical-analysis error.
The ALFRED help page explains the role of vintage records in reproducing research and analyzing decisions using information available in the past. It also describes how release dates are determined when source information is incomplete. For time-sensitive research, examine that provenance instead of assuming every historical value carries a precise original publication timestamp.
| Field | Meaning | Common mistake |
|---|---|---|
| Observation date | Period that the estimate describes | Treating it as the publication time |
| Vintage date | Date whose available information is requested | Confusing it with a new observation |
| Initial value | First published estimate for an observation | Assuming it was available during that observation period |
| Later value | Estimate available in a later vintage | Calling it permanently final |
| Retrieval time | When your project downloaded the file | Treating a recent download as evidence of past availability |
Ask whether you need the latest history or the historical information set
A report describing the economy with the most complete information currently available has a different purpose from a study of what people could have known before a decision. The first can reasonably use the latest available vintage, with a citation and retrieval date. The second needs an information cutoff and appropriate vintage data.
Consider a hypothetical business expanding its inventory after seeing a growth indicator. An evaluation of that decision should use the indicator version available when the inventory order was authorized. Replacing it with a revised series changes the inputs to the decision rule. It may make the earlier decision look more informed, or more foolish, than it actually was.
This does not make revised statistics bad. It makes the dataset a component of the question. Use later estimates to evaluate realized outcomes when that matches your objective, and use historically available estimates to reconstruct the inputs. Keep those roles separate in the analysis rather than combining them in one column labeled simply “actual.”
Before downloading anything, write one sentence: “This analysis uses information available by [date] to answer [question].” If the question is descriptive rather than historical, say that too. The sentence guides the data request, transformations, and interpretation of the resulting chart.
Compare two vintages without confusing revisions with new coverage
The following complete program compares two synthetic index releases. It uses Decimal so the displayed differences follow the fixture's decimal values directly. February is only present in the later release; that is an addition, not a revision to an earlier February value.
from decimal import Decimal

# Invented index values for a workflow demonstration, not official statistics.
first = {
    "2025-12": Decimal("100.0"),
    "2026-01": Decimal("101.0"),
}
later = {
    "2025-12": Decimal("100.4"),
    "2026-01": Decimal("100.8"),
    "2026-02": Decimal("101.3"),
}

common = sorted(first.keys() & later.keys())
revisions = {month: later[month] - first[month] for month in common}
added = sorted(later.keys() - first.keys())
removed = sorted(first.keys() - later.keys())

assert revisions == {
    "2025-12": Decimal("0.4"),
    "2026-01": Decimal("-0.2"),
}
assert added == ["2026-02"]
assert removed == []

for month in common:
    print(month, "first:", first[month], "later:", later[month],
          "revision:", revisions[month])
print("New coverage:", added)
print("Missing from later vintage:", removed)
The program makes three outcomes visible: a changed value, a newly covered period, and a removed period. That distinction matters in a revision chart. If missing values are filled with zero before subtraction, a newly released observation can appear as an enormous revision. An inner comparison alone has the opposite risk: it excludes coverage changes without reporting them.
The synthetic December revision is positive and the January revision is negative. Their signs do not establish a persistent statistical bias; there are only two common observations, and the values were invented. A real revision study needs a defined series, vintage selection, sample period, units, and treatment of missing or discontinued observations.
Check units before interpreting differences. A change of 0.4 in an index is 0.4 index points. It is not automatically a 0.4 percent revision. A percentage revision would also depend on the chosen denominator, and can behave poorly near zero. Preserve the raw levels alongside any transformed comparison so a reader can understand the calculation.
Reconstruct availability before applying a historical rule
The second standalone program shows a small synthetic release ledger. It records when each version became available and chooses only versions available by the cutoff date. The ledger uses dates for teaching simplicity; a real same-day decision may require precise timestamps and time zones.
from datetime import date
from decimal import Decimal

# Synthetic index observations and release dates; no live economic data.
ledger = [
    ("2025-12", date(2026, 1, 15), Decimal("100.0")),
    ("2026-01", date(2026, 2, 15), Decimal("101.0")),
    ("2025-12", date(2026, 3, 15), Decimal("100.4")),
    ("2026-01", date(2026, 3, 15), Decimal("100.8")),
    ("2026-02", date(2026, 3, 15), Decimal("101.3")),
]

def available_as_of(cutoff):
    selected = {}
    for observation, released, value in sorted(ledger, key=lambda row: row[1]):
        if released <= cutoff:
            selected[observation] = value
    return selected

february_view = available_as_of(date(2026, 2, 20))
march_view = available_as_of(date(2026, 3, 20))
assert february_view == {
    "2025-12": Decimal("100.0"),
    "2026-01": Decimal("101.0"),
}
assert "2026-02" not in february_view
assert march_view["2026-01"] == Decimal("100.8")

# A synthetic rule, not an investment recommendation.
threshold = Decimal("100.9")
assert (february_view["2026-01"] > threshold) is True
assert (march_view["2026-01"] > threshold) is False
print("Replacing the original input with a revision changes this toy rule")
The threshold example is deliberately simple. Its purpose is to show how later information can alter a reconstructed decision, not to suggest that a threshold predicts a market or guides an investment. In a real system, input availability also includes publication delays, your data provider's arrival time, and the time needed to process the data.
If two versions share the same recorded date, date-only ordering may be insufficient. Specify a release sequence or timestamp rather than relying on file order. If the ledger omits an intermediate version, the reconstructed view may be wrong even when the selection function works perfectly. Code correctness and archive completeness are different responsibilities.
Retrieve ALFRED data with the output meaning in mind
The ALFRED download guide distinguishes complete observations by vintage, only new and revised observations, real-time periods, and initial-release-only output. Choose the format that matches your analysis. A file of changes is not a complete snapshot; treating absent rows as absent economic activity would misread its structure.
The FRED observations API documents separate parameters for observation periods and real-time periods, as well as vintage_dates and output types. In that endpoint, output_type=4 represents initial releases, while types 2 and 3 distinguish all vintage observations from new and revised observations. Check the documented defaults when constructing a request: leaving a historical-information parameter unspecified can return a current view.
For a reproducible project, save the request specification, response metadata, original download, retrieval timestamp, and a checksum. Record the source series identifier, title, units, frequency, seasonal-adjustment status, transformations, and selected vintages. The downloaded README or metadata is part of the evidence, not optional clutter around the numbers.
A dataframe with one observation-date index can be convenient, but a vintage analysis often needs both observation and availability dimensions. Make the key explicit before joining series. Two indicators released on different schedules cannot safely be aligned merely because both carry the same month label.
Read revisions as a measurement process, not a conspiracy or a guarantee
A revision asks for explanation. Check the original agency's release notes and methodology before assigning a cause. Later responses, seasonal adjustment, benchmarking, classification changes, or corrected mistakes can affect a series in different ways. The Bureau of Labor Statistics payroll revision table is one concrete example of an agency publishing a record of revisions rather than hiding them.
Revisions can also affect transformations. If both the current and preceding observations change, a growth rate changes through both parts of the calculation. Comparing two published growth rates is different from computing growth from rounded levels. Explain which method you used, especially when small differences matter to the argument.
“Latest available” is usually a more defensible label than “final.” Future updates may still occur, and a methodological redesign may change what the series measures. A stable value across two downloads does not prove that no revision is possible. It only says those downloads agree for that observation under the recorded request settings.
Can I use today's FRED download in a historical forecasting exercise?
You can use it to study relationships in the current reconstructed history, if you describe that scope. To claim that a forecast could have been made at an earlier time, reconstruct the information actually available then. Chronological train-test splitting alone does not remove later revisions from an input dataset.
Does every revised number mean the original release was wrong?
An initial estimate can be responsibly produced from incomplete information and later improved. Evaluate the release against its stated purpose, method, and revision policy. The existence of a revision is a reason to preserve versions and examine the process, not enough evidence by itself to infer manipulation or incompetence.
Primary sources and reproduction limits
The examples establish reproducible comparison and availability-selection logic using invented data. They do not demonstrate the coverage of any particular ALFRED series, certify its release timestamps, or estimate actual revision magnitudes. Read the selected series' original agency notes when adapting the workflow.