Ocean Heat Content: Why Climate Scientists Measure Energy Below the Surface
Learn how floats and historical observations estimate stored ocean energy and why the metric complements surface temperature.
Reviewed October 10, 2026. Climate indicators describe long-term systems; they do not predict conditions at a specific beach or on a specific day.
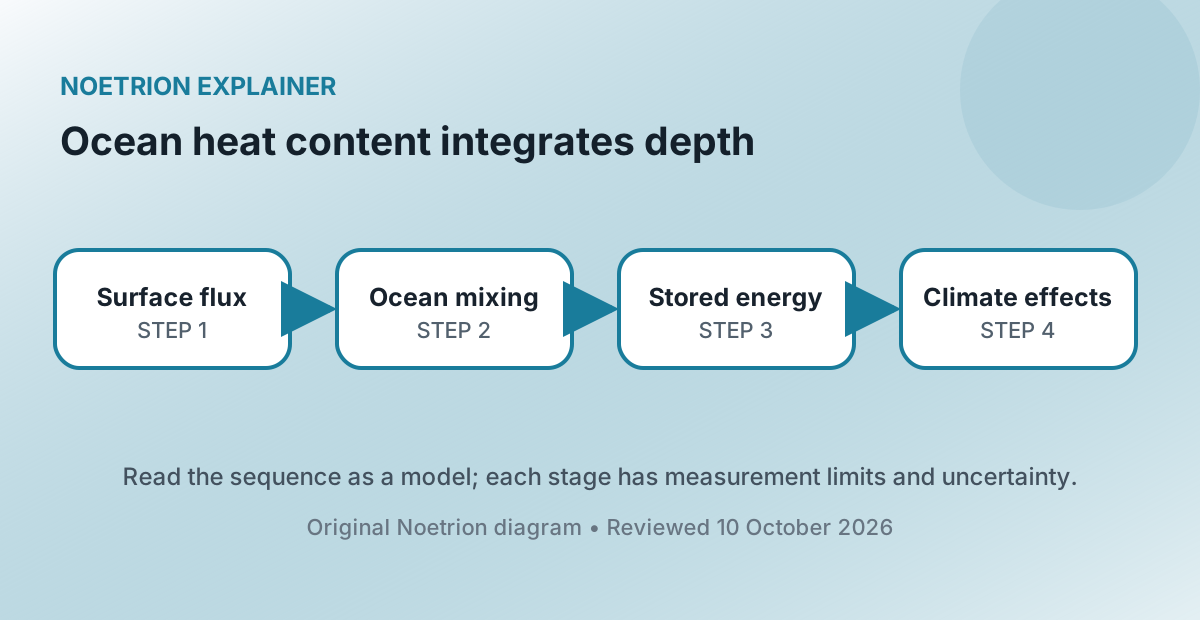
Most of the excess heat retained by the Earth system is stored in the ocean. Surface air temperature remains important because people and ecosystems experience it directly, but it is only one part of the energy budget. Ocean heat content estimates the change in thermal energy stored through a chosen depth and area.
The metric helps scientists track planetary energy imbalance, but it is not a thermometer lowered into one global bathtub. It is reconstructed from many observations with uneven coverage, instrument corrections, mapping methods, and uncertainty estimates.
1. Temperature and heat content are different quantities
Temperature describes thermal state at a location. Heat content combines temperature change with the mass and heat capacity of water. Warming a deep layer by a small fraction of a degree can store enormous energy because the layer contains so much water.
A simplified anomaly calculation sums density multiplied by specific heat capacity, temperature anomaly, and volume across grid cells. Researchers report changes relative to a baseline, commonly in joules or zettajoules. The result depends on the chosen depth, such as the upper 700 metres or 2,000 metres.
2. The ocean dominates heat storage
Greenhouse gases reduce the rate at which energy escapes to space, creating an imbalance between incoming and outgoing energy. The ocean absorbs most of the accumulated excess because it covers most of Earth's surface and water has a high heat capacity. Land, atmosphere, and melting ice store the remainder.
This does not mean the ocean warms uniformly. Currents and winds redistribute heat, mixing varies, and natural variability can shift energy between layers and regions. A global total can rise while a particular surface region temporarily cools.
3. Observations changed across history
Historical temperature profiles came from ships using bottles, mechanical bathythermographs, expendable bathythermographs, and other instruments. Each technology sampled different locations and depths and introduced characteristic biases. Researchers correct known biases and compare overlapping records.
Since the 2000s, the Argo program has deployed thousands of autonomous profiling floats. A typical float descends, drifts, then measures temperature and salinity as it rises through the upper ocean before transmitting data by satellite. Argo dramatically improves broad coverage to about 2,000 metres, though polar ice zones, marginal seas, and the deep ocean still require additional observing systems.
| Measurement issue | Why it matters |
|---|---|
| Sparse early coverage | Unobserved regions must be estimated |
| Instrument bias | Apparent trends can reflect measurement changes |
| Depth limit | Upper-ocean and full-depth heat are different quantities |
| Mapping method | Interpolation influences gridded global estimates |
4. Anomaly baselines do not change the physical trend
An anomaly subtracts an average over a reference period. Choosing a different baseline shifts the vertical zero but does not change year-to-year differences calculated consistently. Articles should state the baseline and depth so readers do not compare unlike series.
Absolute ocean heat content is less useful for communication than change because the enormous background energy dominates. The scientific question is how stored energy is changing and where it is moving.
5. Weather noise and climate signal operate together
El Niño and La Niña redistribute ocean heat and alter exchanges with the atmosphere. Volcanic eruptions, winds, and circulation patterns contribute variability. These processes can create pauses or accelerations over short intervals without reversing the long-term energy accumulation.
Trend estimates should therefore include the period and uncertainty. Selecting a start year at an unusual peak or trough can exaggerate or suppress a rate. A climate claim based on one year is weaker than analysis using the full record and relevant physical context.
6. Stored heat has consequences
Warmer water expands, contributing to sea-level rise alongside added water from melting land ice. Marine heatwaves can stress ecosystems. Ocean heat supplies energy and moisture that can influence weather, while the exact effect on an individual storm depends on atmospheric circulation and many other conditions.
The ocean's heat capacity slows surface warming compared with a system that had no ocean, but it does not make the energy disappear. Heat can remain in the system and continue affecting sea level and ecosystems over long timescales.
7. One conversion can clarify scale—and mislead
Communicators often convert zettajoules into equivalent numbers of bombs, kettles, or national electricity consumption. These analogies can make a huge quantity imaginable, but they do not imply that ocean heat could be recovered as usable electricity. They also depend on the selected comparison and period.
Report joules first, then label any analogy as a scale comparison. Avoid converting a global accumulated energy anomaly into a local temperature forecast.
8. Compare independent products carefully
Research groups publish ocean heat estimates using different bias corrections, mapping methods, and baseline periods. Agreement in the long-term direction across products strengthens confidence. Small differences in annual values are expected and should not be framed automatically as an error by one group.
Read the technical documentation, especially when a dataset is updated. Reprocessing older observations can revise past estimates as methods improve. Climate records are scientific products with versions, not immutable raw numbers.
9. A disciplined interpretation
When reading a chart, identify depth range, geographic coverage, baseline, units, smoothing, and uncertainty. Determine whether it shows annual anomalies, a running mean, or a trend. Check whether the newest year is complete. Then connect the series to other indicators such as sea level, surface temperature, and Earth's energy imbalance.
Ocean heat content is powerful because it measures accumulated energy in the largest reservoir of the climate system. Its scale makes short-term atmospheric fluctuations easier to place in context. Its uncertainty reminds us that a global indicator is built from instruments, sampling, calibration, and transparent statistical reconstruction.