Spreadsheet, SQL, or Python? Choose the right tool for each data job
A decision guide for exploration, shared records, repeatable analysis, and the points where one tool should hand work to another.
Reviewed September 29, 2026. Product limits and documentation links were checked on this date.
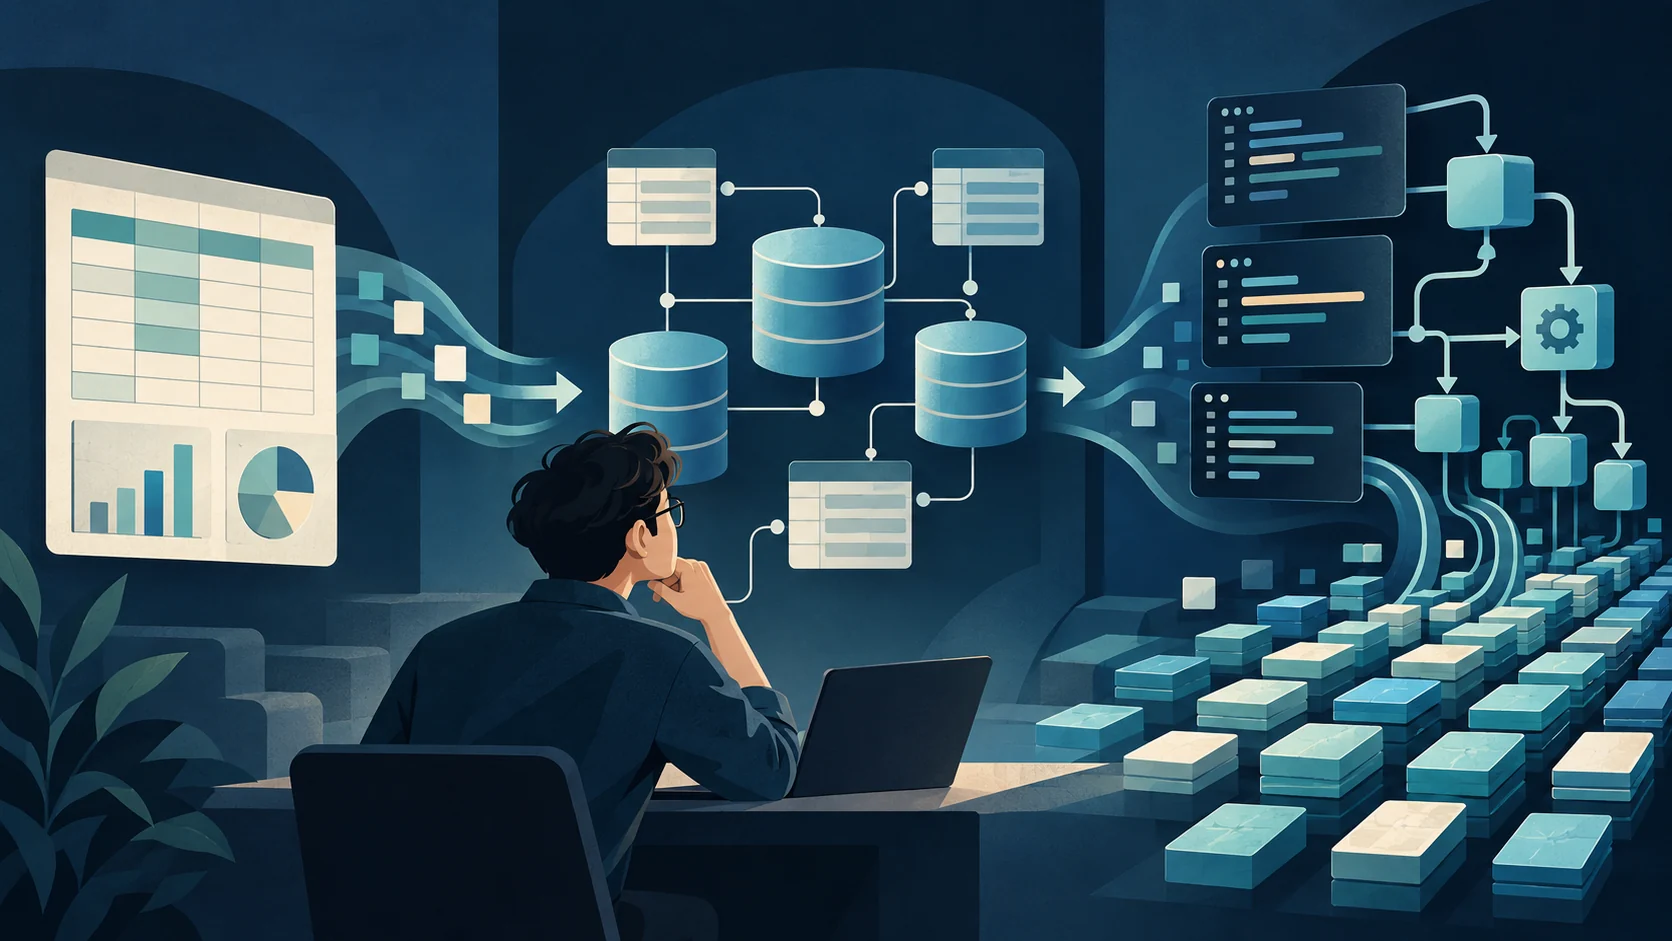
A spreadsheet, a SQL database, and Python can all filter rows, calculate summaries, and produce charts. That overlap makes the choice look like a contest. In practice, they solve different coordination problems:
- A spreadsheet gives people a visible, direct workspace.
- A database with SQL stores shared structured records and answers set-based questions.
- Python expresses a repeatable sequence of transformations, checks, models, and outputs.
The right question is not “Which tool is most powerful?” Ask what must remain visible, repeatable, shared, controlled, and scalable.
A decision matrix
| Need | Spreadsheet | SQL database | Python |
|---|---|---|---|
| Quick manual inspection | Excellent | Possible through a client | Possible, less immediate |
| Shared source of truth | Fragile as complexity grows | Excellent | Uses files or a database |
| Repeatable cleaning | Limited unless carefully structured | Strong for set-based transformations | Excellent |
| Joins across related tables | Possible, harder to govern | Excellent | Strong after loading data |
| Statistical modelling or machine learning | Basic to moderate | Usually prepares the data | Excellent |
| Many concurrent editors or applications | Can become difficult to control | Designed for this | Connects through application logic |
| Audit-friendly automation | Requires discipline | Strong with migrations and query history | Strong with code and version control |
Use a spreadsheet for thinking with your eyes
Spreadsheets are effective when a person needs to scan values, make a small correction, build a quick pivot table, or share a familiar artifact. Labels, formatting, formulas, and charts live together, so the reasoning remains visible to non-programmers.
A spreadsheet's published capacity is much larger than many everyday datasets. Microsoft lists 1,048,576 rows and 16,384 columns per Excel worksheet. That is a technical ceiling, not a recommendation to use a million-row workbook as an operational database. Performance depends on formulas, memory, data models, and the surrounding process. More importantly, capacity does not solve provenance, validation, access control, or repeatability.
Good spreadsheet jobs
- Exploring a small export and spotting obvious issues.
- Maintaining a short planning table with human judgment in each row.
- Creating a one-off calculation whose formulas can be reviewed cell by cell.
- Delivering a familiar table or chart to someone who needs to edit it.
Warning signs
- People email copies named
final_v7_revised.xlsx. - One formula is copied across thousands of rows and nobody knows where it changed.
- Raw data, manual corrections, calculations, and presentation share the same sheet.
- Several people or systems must update the same records.
- The report must be regenerated every week from new files.
Use SQL when relationships and shared state matter
A relational database stores data in tables with explicit columns, types, keys, and relationships. SQL lets you filter, join, aggregate, insert, and update those sets. PostgreSQL's official tutorial introduces table creation, queries, joins, aggregate functions, updates, deletions, transactions, and window functions because these operations form the core of relational work.
Suppose a campus shop has separate tables for orders, order_items, products, and students. Repeating every student and product field on every row creates inconsistencies. A database can keep one student record, connect orders through keys, and enforce rules such as a unique order ID.
SELECT
    p.category,
    SUM(oi.quantity * oi.unit_price) AS revenue
FROM order_items AS oi
JOIN products AS p ON p.product_id = oi.product_id
JOIN orders AS o ON o.order_id = oi.order_id
WHERE o.paid_at >= DATE '2026-09-01'
GROUP BY p.category
ORDER BY revenue DESC;
This query states the result without describing a cell-by-cell procedure. The database decides how to execute it and can use indexes to avoid scanning unrelated rows.
What transactions add
A transaction groups related changes. For a purchase, reducing stock and recording the payment should succeed together or fail together. That property is difficult to reproduce safely with several manually edited files.
Use Python when the process must be rerun
Python is useful when analysis has multiple stages: load several files, standardize columns, validate types, calculate features, run a statistical test, create charts, and export a report. The code becomes an executable record of the method.
pandas represents a table as a DataFrame and supports common sources such as CSV, Excel, SQL, JSON, and Parquet. Its documentation also maps familiar SQL operations such as SELECT, GROUP BY, and JOIN to pandas equivalents.
import pandas as pd

orders = pd.read_csv('orders_2026-09.csv', parse_dates=['paid_at'])

assert orders['order_id'].is_unique
assert orders['quantity'].ge(0).all()

summary = (
    orders.assign(revenue=orders['quantity'] * orders['unit_price'])
          .groupby('category', as_index=False)['revenue']
          .sum()
          .sort_values('revenue', ascending=False)
)

summary.to_csv('monthly_revenue.csv', index=False)
The two assertions turn assumptions into checks. When the next file arrives, the same steps run again. If a column disappears or an order ID is duplicated, the pipeline stops near the cause instead of quietly producing a different report.
Reproducibility changes the decision
The UK Government Analysis Function describes Reproducible Analytical Pipelines as a way to minimize manual copy-paste and point-click steps, use well-commented code, apply peer review and quality assurance, and retain an audit trail with version control. These principles apply beyond government statistics.
Reproducible does not mean “Python everywhere.” It means another person can identify the inputs, rerun the method, see the checks, and obtain the same output under documented conditions. SQL scripts, spreadsheet templates, configuration files, and manual steps can all be part of that record.
A realistic hybrid workflow
Consider a monthly student-commerce report assembled from an order system and a survey.
Store validated orders→SQL
Select and aggregate→Python
Clean, test, chart→Spreadsheet
Review and annotate
- Database: keep orders, products, and customer IDs with constraints and controlled access.
- SQL: select the reporting period and compute trusted aggregates close to the data.
- Python: merge survey data, validate missingness, calculate confidence intervals, and create plots.
- Spreadsheet: give reviewers a compact table for comments or approved adjustments.
- Publication: generate the final artifact from versioned inputs and code, then archive the run metadata.
The spreadsheet remains valuable. It simply stops carrying responsibilities better handled by a database or code.
When should you move?
| Current pain | Likely next move | First practical step |
|---|---|---|
| Repeated manual cleaning | Spreadsheet → Python | Script one stable transformation and compare its output with the manual result. |
| Conflicting copies and simultaneous edits | Spreadsheet → database | Define a canonical table, primary key, and who may update each field. |
| Complex joins across exports | Spreadsheet → SQL | Load clean tables into SQLite or PostgreSQL and reproduce one report query. |
| Python loads more data than memory comfortably holds | Python file workflow → SQL/columnar storage | Filter and aggregate before loading; use Parquet or a database. |
| SQL query grows into modelling and chart logic | SQL → SQL plus Python | Keep extraction in SQL and move statistical analysis into tested code. |
A five-question rule
- How many people or systems edit the source? Shared operational state favors a database.
- Must the process run again? Repetition favors code and versioned queries.
- Does a reviewer need direct visual editing? A controlled spreadsheet may be the best interface.
- Are relationships and integrity rules central? Use SQL and database constraints.
- Does the work require statistics, machine learning, or custom automation? Use Python around a well-defined data source.
Choose the smallest tool that makes the work understandable today and defensible tomorrow. Moving too early creates unnecessary infrastructure; moving too late creates invisible manual work that becomes difficult to verify.