Survey Weights Can Repair the Mix Without Creating More Respondents
Calculate a weighted survey estimate, inspect unequal-weight concentration, and understand why matching population totals does not eliminate nonresponse bias.
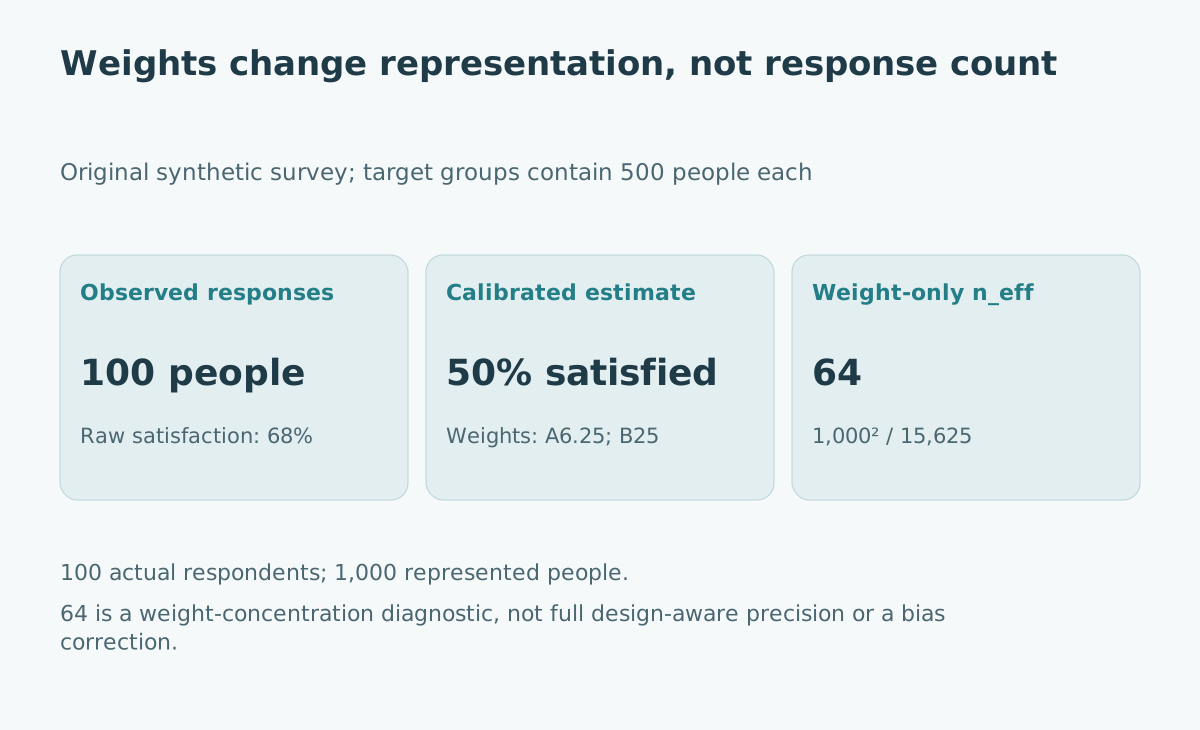
A customer survey receives 100 responses. Eighty come from one user group and twenty from another, although the two groups are equally common in the customer base. The raw satisfaction rate is 68%. After weighting, it becomes 50%.
Which number should the team report? First explain whose opinion each number describes. The unweighted result describes the respondents. The weighted result tries to describe a defined target population under assumptions about how respondents represent people who did not answer.
This evergreen guide, checked on 28 October 2026, uses an original synthetic survey. It separates three quantities that dashboards often blur: respondent count, the population represented by the weights, and a weight-concentration diagnostic sometimes called effective sample size.
Define the target before calculating weights
Suppose an organization knows that its eligible customer population contains 500 people in group A and 500 in group B. Everyone was invited once, and 80 A customers and 20 B customers answered the satisfaction question. There are no duplicate respondents or missing item responses in this simplified example.
The U.S. Census Bureau's SIPP methodology explains that different responding people may represent different numbers of population members because selection, response and coverage can differ. It also emphasizes that choosing a weight depends on the intended population and reference period.
Our example is a much simpler calibration exercise, not an application of SIPP's survey design. Define the customer population, reference date and eligibility rules explicitly before using its totals. A current subscription database cannot automatically supply the right population totals for a survey about last year's customers.
Reconstruct the weighted estimate from counts
Assign each A respondent weight 500/80 = 6.25 and each B respondent weight 500/20 = 25. These weights make the represented group totals match the known target counts.
| Group | Target people | Respondents | Satisfied respondents | Weight per respondent |
|---|---|---|---|---|
| A | 500 | 80 | 64 | 6.25 |
| B | 500 | 20 | 4 | 25 |
| Total | 1,000 | 100 | 68 | Varies |
The raw fraction is (64 + 4)/100 = 68%. The weighted fraction is (64 × 6.25 + 4 × 25)/(80 × 6.25 + 20 × 25) = 500/1,000 = 50%.
Weighting does not change anybody's answer. It changes how strongly each answer contributes to an estimate for the target population. The 1,000 in the denominator is a represented population total, not the number of independent people who answered.
Say what the adjustment assumes
In this exercise, the weighted estimate treats respondents as representative of their respective groups for satisfaction. That is an assumption, not a consequence of matching group counts.
If unhappy B customers are much less likely to respond than happy B customers, all B respondents receiving the same weight does not remove that within-group difference. Even exact calibration to both known totals cannot reveal the missing satisfaction answers.
The NHANES weighting tutorial describes separate adjustments for selection, nonresponse and population control totals in its actual complex design. It also distinguishes survey-component participation from item nonresponse. Borrow the discipline of documenting those stages; do not assume a two-group customer adjustment reproduces the representativeness of a major probability survey.
Inspect concentration without confusing it with new information
A common weight-only diagnostic is n_eff,w = (sum of weights)² / sum of squared weights. For this example, the sum of weights is 1,000. The sum of squared weights is 80 × 6.25² + 20 × 25² = 15,625. Therefore n_eff,w = 1,000,000/15,625 = 64.
The 100 respondents still exist. The value 64 summarizes how unequally their answers are weighted under this particular diagnostic. Multiplying every weight by the same constant leaves both the weighted mean and this effective-size calculation unchanged.
If all 100 respondents had equal positive weights, the diagnostic would equal 100. Concentrating weight on fewer records reduces it. That is useful for spotting heavy dependence on a relatively small portion of the responding sample, but it does not identify which answers are biased.
Do not use the shortcut as a full uncertainty calculation
The authors' PracTools design-effects vignette, dated 16 September 2026, explains that Kish's unequal-weight formula rests on restrictive assumptions. It also shows why weighting alone does not capture stratification, clustering or relationships between weights and the analysis variable.
A full design effect is specific to an estimator and a survey design. Effective sample sizes based on design-aware variance estimates can consequently differ across outcomes measured in the same survey. The weight-only value 64 is not a universal information count for this dataset.
For a complex public survey, follow its documentation and use the supplied strata, cluster identifiers or replicate weights with suitable survey-analysis software. Do not replace the documented design with a spreadsheet formula and then publish a conventional simple-random-sample margin of error.
Investigate empty cells and dominant weights
If no B customers answered, 500/0 would be undefined. No finite weight creates observed B opinions. A report must acknowledge that coverage gap, collect additional evidence or use an explicit model with assumptions and uncertainty. Silently filling the group with A's rate would answer an invented question.
Large weights also deserve investigation. They can indicate sparse cells, uneven response, or an intentional sample design. Automatically deleting heavily weighted respondents can reintroduce representation problems.
Weight trimming trades one set of properties for another. If used, state the rule, recalibration method and sensitivity of the estimate. A reassuringly larger weight-only effective sample size after trimming does not, by itself, establish a more accurate estimate.
Make the survey report inspectable
For this example, a concise report would state: 100 respondents; 68% satisfied among respondents; 50% after calibration to the stated 500/500 customer totals; and a weight-only concentration diagnostic of 64. It would describe the within-group representativeness assumption and avoid claiming that the true customer satisfaction rate is known exactly.
Also disclose invitation coverage, response counts by weighting group, item missingness, source and date of target totals, construction rules and any trimming. Compare weighted and unweighted results as a sensitivity description rather than choosing whichever number supports the preferred story.
When combining survey records with customer data, preserve one row per intended response unit. The join-cardinality guide explains how duplicated records can corrupt totals before the statistical adjustment even begins.
Sources and scope
- U.S. Census Bureau, SIPP weighting methodology, page revised 18 August 2022: official explanation of differential representation and choosing appropriate weights.
- CDC/NCHS, NHANES weighting tutorial, checked 28 October 2026: official construction stages and component-specific weighting guidance.
- George Zipf and Richard Valliant, PracTools: Design Effects and Effective Sample Size, dated 16 September 2026: package authors' methodological documentation and limitations of weight-only shortcuts.
The 1,000-person population, 100 responses and all satisfaction figures are invented. No result above estimates an actual organization's satisfaction, and no confidence interval is implied by the weight-only calculation.