A Faster AI Task Does Not Automatically Become Faster Economic Growth
Read AI productivity claims by separating task speed, accepted output, hours worked and economic growth, with a worked example and a practical evidence checklist.
A team cuts the time needed to draft a report from one hour to half an hour. Someone calls that a 100% productivity improvement. Someone else expects the same percentage increase in the company's revenue. Both statements skip the most useful question: what happened to the finished, usable output and to all the work required to deliver it?
This distinction matters during the current debate about AI investment and economic growth. The OECD's June 2026 productivity compendium describes uneven productivity performance across countries and industries. Its executive summary treats AI's possible contribution cautiously. A September 2026 IMF working paper on productivity measurement argues that accounting methods can also miss some service improvements. Neither establishes that a faster individual task mechanically produces a matching national growth rate.
Start with a numerator and a denominator
The US Bureau of Labor Statistics defines labor productivity as real output divided by hours worked. It is a relationship between output and one input, not a score for how hard an employee tries. Technology, management, skills and capital can all affect that relationship.
For a small operational exercise, use accepted reports per total labor hour. That is a team metric, not a national-accounts measure. Define “accepted” before comparing periods: the report meets the same completeness, accuracy and turnaround requirements. Include drafting, checking, correction and coordination hours within the boundary. If managers review drafts outside the tracked tool, their time still belongs in the denominator.
This definition immediately changes the question. A model can generate more words while the team delivers no more accepted reports. Word production measures a different output.
Work through an example that keeps the boundary fixed
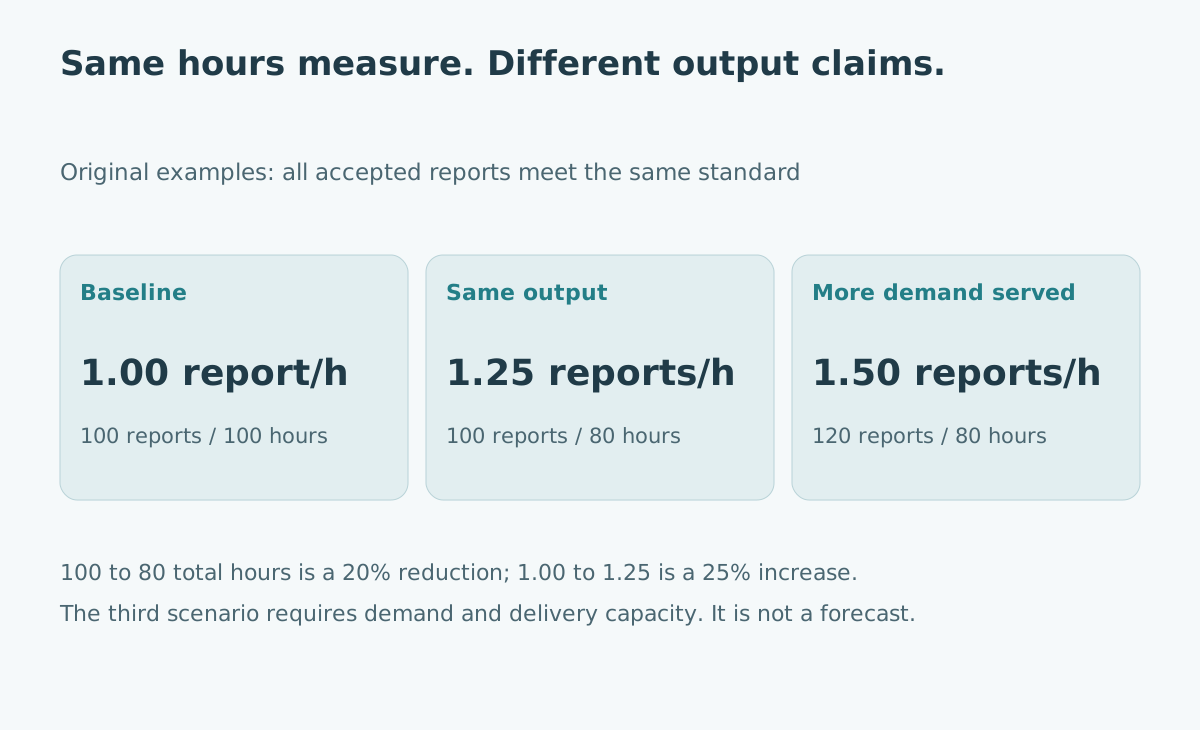
Suppose a fictional team delivers 100 comparable reports using 100 total hours. After introducing an assistant, it delivers the same 100 reports using 80 hours. The original productivity is 1 report per hour; the new productivity is 1.25. Output per hour rises 25%, while labor hours fall 20%.
| Hypothetical period | Accepted reports | Total labor hours | Reports per hour | Interpretation |
|---|---|---|---|---|
| Baseline | 100 | 100 | 1.00 | Starting comparison |
| Same output, fewer hours | 100 | 80 | 1.25 | Productivity +25%; output unchanged |
| Extra demand is served | 120 | 80 | 1.50 | Productivity +50%; output +20% |
| Review time omitted | 100 | 60 recorded + 20 omitted | 1.25 on complete hours | A dashboard showing 1.67 is incomplete |
The third row requires more than task speed. Customers must want the additional reports, and the organization must be able to sell, review and deliver them. The table assumes these conditions rather than predicting them.
The general comparison is (new output / old output) / (new hours / old hours) - 1. Here, 1 / 0.8 - 1 = 0.25. Subtracting percentage changes can be a rough approximation for small movements; it is not the exact calculation.
Saved time is a capacity option
Twenty released hours can support extra output, shorter working time, maintenance or learning. They can also remain unused when another bottleneck limits delivery. A manager should name the intended use rather than entering all released hours as additional revenue.
Consider a team with a fixed approval slot for 100 reports. Faster drafting creates a queue in front of approval. Purchasing more generation capacity will not necessarily increase accepted deliveries. The next experiment should measure the constraint, perhaps reviewer availability or missing customer information.
This is an operational inference from the example, not a finding that AI adoption usually fails. The point is to observe the path from a task improvement to a business outcome.
Separate labor productivity from the return on all inputs
A workflow can use fewer employee hours while requiring expensive compute, integration and support. The labor metric may improve even if the business case is weak. Conversely, a modest labor improvement may be valuable when it prevents costly mistakes.
The Reserve Bank of Australia's productivity explainer distinguishes labor productivity from multifactor productivity, which relates output to combined inputs. Neither measure should be casually substituted for profit. For a purchase decision, keep a second ledger for subscription costs, equipment, implementation and ongoing oversight.
For example, a fictional $600 monthly labor saving alongside $800 of incremental monthly service and oversight expense is a negative $200 direct monthly balance under those assumptions. It could still have other benefits, but those benefits need their own evidence. Avoid calling the labor saving a net financial return.
Why a real service improvement can be hard to measure
Some useful changes concern quality rather than a larger count: a clearer explanation, a more accessible interface or fewer missed details. A count of reports can overlook these benefits. It can also reward low-quality quantity unless acceptance criteria remain stable.
The September IMF working paper discusses difficulties including non-market service valuation and incomplete quality adjustment. This is a measurement argument, not proof that an unspecified hidden AI boom has already occurred. Better measurement could reveal benefits, costs or a mixture of both.
For the report team, add an independently checked error rate and a turnaround distribution. Do not combine them into an unexplained “quality-adjusted productivity” number. Publish the component measures so a reader can inspect the trade-off.
Do not convert one task result into a macroeconomic forecast
An economy includes activities with different technologies, adoption constraints and measurement methods. A result from selected volunteers performing one task does not describe every firm or every hour of work. Implementation also takes time.
There is a separate timing trap in economic releases. The BLS explanation of quarterly productivity volatility explains that quarterly changes may be reported at compound annual rates. A hypothetical 1% quarter-to-quarter increase corresponds to approximately 4.06% annualized: (1.01^4 - 1) × 100. It does not mean output per hour actually grew 4.06% during that quarter, nor that the pace will continue.
Label the geography, sector, period, revision vintage and rate convention before comparing two headlines. A quarterly annualized rate and a calendar-year change answer different questions.
Build a short evidence ledger before making a decision
Use one row per claim, rather than one overall verdict about whether AI “works.”
| Claim | Evidence needed | Decision it can support |
|---|---|---|
| Drafting is faster | Comparable task timing | A bounded workflow experiment |
| Delivery is more productive | Accepted output and complete hours | Capacity planning |
| Adoption creates financial value | Incremental cash costs and benefits | A purchase or renewal |
| Economy-wide growth is stronger | Broad, consistently measured economic data | A macroeconomic interpretation |
Before renewing a tool, record the baseline, the acceptance rule, the time boundary and the next review date. Compare similar work and investigate quality differences. Keep failed or abandoned tasks in the record rather than measuring only the clean successes.
The practical payoff is a narrower, more defensible statement: “We delivered the same accepted output with 20% fewer tracked total hours in this comparison.” That is already useful. It does not need to become an unsupported forecast about the whole economy.
For a complementary financial calculation, see how AI business ROI changes when rework and oversight are counted.
Sources and scope
- OECD Compendium of Productivity Indicators 2026, published 23 June 2026; executive summary reviewed for context, not causal identification of AI effects.
- IMF: Generative AI and the Limits of Productivity Measurement in the System of National Accounts, September 2026 working paper; retrieved analytical summary reviewed. Its measurement argument is distinguished from an empirical estimate.
- BLS: Office of Productivity and Technology—Concepts, methodology checked 28 October 2026.
- RBA: Productivity, educational explainer checked 28 October 2026.
- BLS: Interpreting volatility in quarterly labor productivity, 2023 methodology article, used for rate conventions rather than current economic estimates.
All team figures and cost amounts are invented teaching examples. This article does not estimate AI's contribution to current GDP or recommend a specific investment.