Bayes and Diagnostic Tests: Why Accuracy Is Not Your Probability
Connect sensitivity and specificity to pre-test probability, likelihood ratios, post-test risk, and the consequences of false results.
Reviewed October 11, 2026. This article is not individualized medical advice.
Connect sensitivity and specificity to pre-test probability, likelihood ratios, post-test risk, and the consequences of false results.
| Concept | What it means | Important limit |
|---|---|---|
| Sensitivity | Positive among people with the condition | Does not equal probability of disease after a positive |
| Specificity | Negative among people without it | Does not by itself state false alarms in screening |
| Positive predictive value | Condition among positive results | Changes with prevalence |
| Likelihood ratio | Strength of test evidence | Still requires pre-test odds |
1. A test result changes a probability; it rarely creates certainty
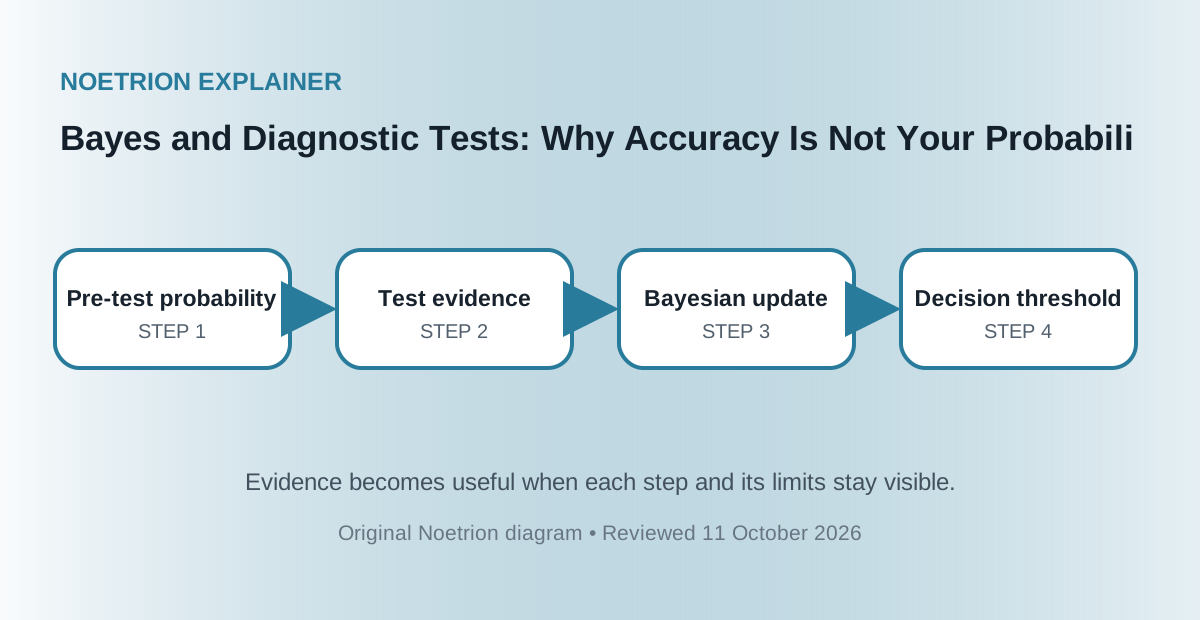
Before testing, a person has some probability of a condition based on symptoms, exposure, age, prevalence, and other evidence. The test contributes new evidence with imperfect sensitivity and specificity. Bayes’ theorem combines the two. This framing prevents a common error: reading “95% accurate” as a 95% chance that a positive result is true. The probability after a result depends on how common the condition was in the tested population and on the exact pattern of false positives and false negatives.
2. Sensitivity and specificity condition in the opposite direction
Sensitivity asks: among people who truly have the condition, what fraction tests positive? Specificity asks: among those who do not, what fraction tests negative? A patient usually asks the reverse: given my positive result, what is the chance I have the condition? Reversing a conditional probability is invalid unless base rates are incorporated. A highly sensitive and specific test can still produce many false positives when applied to a very large low-risk population because the non-diseased group is enormous.
3. Natural frequencies make the base-rate effect visible
Imagine screening 10,000 people when prevalence is 1%. There are 100 true cases and 9,900 non-cases. With 90% sensitivity, 90 cases test positive and 10 are missed. With 95% specificity, 5% of non-cases—495 people—also test positive. Among 585 positive results, only 90 are true cases, about 15%. The exact values are hypothetical, but the arithmetic shows why predictive value is not a fixed property of a test. It changes when the tested population changes.
4. Likelihood ratios express the strength of evidence
The positive likelihood ratio is sensitivity divided by one minus specificity. It says how much more likely a positive result is among people with the condition than among those without it. The negative likelihood ratio is one minus sensitivity divided by specificity. Bayesian updating is convenient in odds form: post-test odds equal pre-test odds multiplied by the relevant likelihood ratio. Convert probability to odds with p/(1-p), perform the multiplication, then convert back using odds/(1+odds).
5. Thresholds should be chosen around consequences
Testing serves a decision: treat, investigate further, reassure, isolate, or monitor. A false negative may delay treatment; a false positive may cause anxiety, invasive procedures, or unnecessary therapy. The acceptable trade-off differs by disease severity, treatment risk, and whether a confirmatory test exists. Screening often favors sensitivity so cases are not missed, followed by a more specific confirmation. Reporting one threshold-independent summary cannot replace a decision analysis that describes what happens after each possible result.
6. Reference standards and study populations can bias estimates
Sensitivity and specificity require knowing the true condition status, usually through a reference standard that may itself be imperfect. Verification bias occurs when only some participants receive that standard, perhaps because their initial test was positive. Spectrum bias appears when a study compares obvious severe cases with very healthy controls, producing performance unlike real clinics. Reader blinding, sample handling, missing results, and threshold selection also matter. Accuracy estimates should include uncertainty intervals and a description of who was enrolled.
7. Repeated tests are not automatically independent
If two tests respond to the same biological feature, their errors may be correlated. Multiplying likelihood ratios as though each result were independent can overstate certainty. A repeat sample may reduce random laboratory error but not a systematic cross-reactivity. Clinicians should consider whether the second test adds new information, uses a different mechanism, or merely repeats the same weakness. Evidence from a sequential testing strategy is stronger when that exact strategy was evaluated in an appropriate population.
8. Communicate both probability and action
A useful result discussion states the estimated pre-test probability, the test’s evidence, the resulting range, and the next step. Natural frequencies can be clearer than percentages alone. Uncertainty should be explicit, especially when prevalence is borrowed from a population unlike the patient. A positive result may mean “confirm with a reference test,” while a negative may mean “condition is now unlikely unless symptoms persist.” The number becomes meaningful only when connected to consequences and follow-up.
Conclusion
Bayesian reasoning does not make diagnosis mechanical; it makes the logic auditable. Base rates establish the starting point, test characteristics determine the update, and clinical consequences determine the action. Keeping those roles separate protects patients from both false certainty and reflexive distrust of useful tests. Good probability communication also makes shared decisions more honest.