Break-Even Analysis for Small Businesses: The Number That Changes Your Pricing
Learn break-even analysis and contribution margin with a worked example, scenario table, and pricing decisions small businesses can actually use.
Educational analysis, not a personal investment or payment recommendation. Check the dated sources and the rules that apply in your jurisdiction.
A product can sell well and still lose money. The usual culprit is not a mysterious accounting trick: the price does not leave enough money after each sale to cover the costs of running the business.
Break-even analysis makes that problem visible. The US Small Business Administration explains the core formula for a single product as:
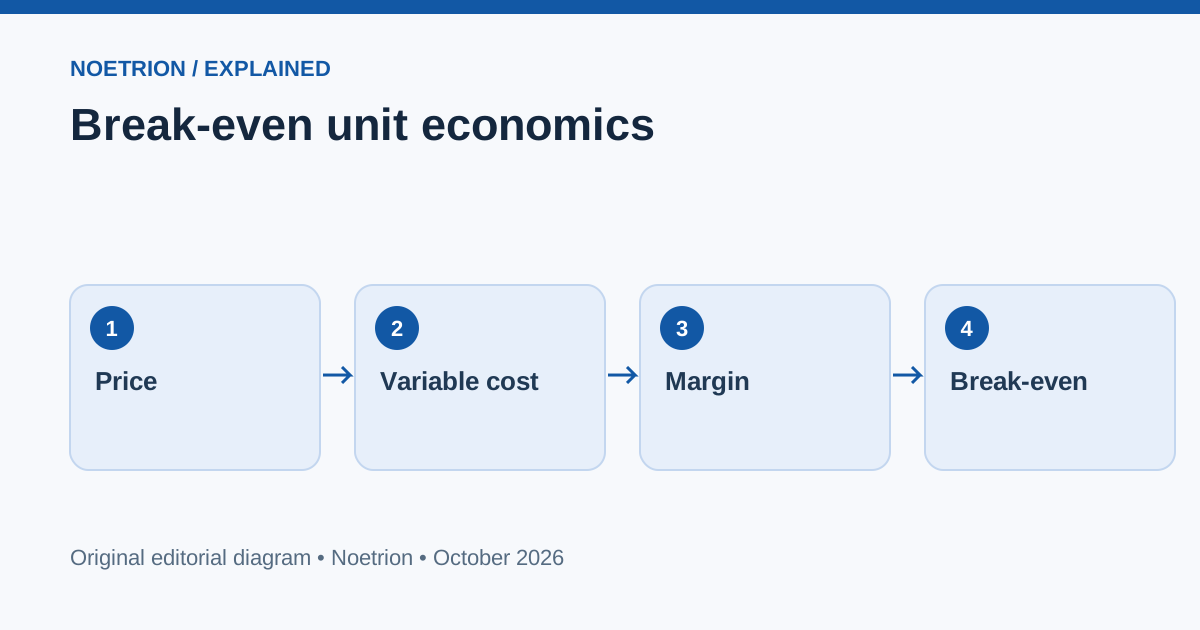
Break-even units = fixed costs ÷ (selling price per unit − variable cost per unit).
The term in parentheses is the contribution margin per unit. It represents the amount each additional sale contributes toward fixed costs and, after break-even, operating profit under the model's assumptions.
A simple example: an online notebook shop
Imagine a fictional shop selling digital and printed notebooks. For simplicity, consider one physical product:
- Selling price: $20 per notebook.
- Variable cost: $8 per notebook, including printing, packaging and per-order fees.
- Monthly fixed costs: $1,200, including rent, software and other overhead.
Contribution margin is $20 − $8 = $12. The shop needs $1,200 ÷ $12 = 100 notebooks to cover its modeled monthly fixed costs. At 100 sales, revenue is $2,000 and variable costs are $800, leaving $1,200 to cover fixed costs.
This is an illustrative calculation, not observed business data. It ignores taxes, financing, capacity limits, refunds and other complexities unless they are included in the inputs.
Small changes can move the target dramatically
| Scenario | Price | Variable cost | Margin per unit | Break-even units |
|---|---|---|---|---|
| Base case | $20 | $8 | $12 | 100 |
| Discounted price | $18 | $8 | $10 | 120 |
| Higher input costs | $20 | $10 | $10 | 120 |
| Higher price | $22 | $8 | $14 | 86* |
The final result rounds up from approximately 85.7 units because a business cannot sell a fraction of a notebook.
A $2 discount increases the required monthly sales volume by 20% in this example. That does not automatically make the discount a bad idea: it could attract more customers. But the extra volume must be evaluated, not assumed.
Why revenue growth can mislead
Suppose a company doubles sales by paying expensive advertising fees and offering deep discounts. Revenue rises, but contribution margin per order may shrink. If the business does not track variable fulfillment and acquisition costs, it may celebrate growth that worsens cash flow.
A practical monthly dashboard should include units sold, average selling price, variable cost per unit, contribution margin, fixed costs and cash on hand. For a multi-product business, calculate the mix of products rather than assuming all sales contribute equally.
Distinguish fixed and variable costs carefully
The SBA notes that some expenses are semi-variable: they contain fixed and variable components. Software subscriptions with usage charges, utilities with minimum fees and certain logistics contracts can behave this way.
Classifying a cost incorrectly makes the break-even number look more precise than it is. Revisit assumptions when volume changes. At high volumes, a business may need extra staff, storage or equipment, creating new fixed-cost steps.
Use break-even analysis as a decision tool
Before launching a promotion, compare three scenarios: expected sales, conservative sales and optimistic sales. Calculate contribution margin in each case. Then ask whether the cash balance can withstand the conservative outcome.
For a subscription business, the same principle applies, but customer acquisition cost, retention, churn and ongoing servicing costs require additional modeling. Do not force a one-product formula onto every business model.
A 20-minute action plan
List last month's fixed costs. Estimate the true variable cost of one sale. Calculate contribution margin and break-even units. Compare the result with actual volume. Finally, identify one input—price, cost, product mix or retention—that you can test without betting the entire business.
The goal is not to predict the future perfectly. It is to make pricing decisions with visible assumptions.
FAQ
Is break-even the same as positive cash flow?
No. Timing of payments, inventory purchases, debt repayments and taxes can cause cash flow to differ from modeled operating profit.
Does selling above break-even guarantee a healthy business?
No. The model depends on accurate costs, sustainable demand and adequate cash reserves.
Sources and further reading
- US Small Business Administration, break-even point
- US Small Business Administration, plan your business
Editorial notes
Visual: Break-even unit economics. Original vector chart of price, variable cost, contribution margin and fixed-cost break-even threshold.
Verification note: Facts were checked against the linked primary or specialist sources on 13 October 2026. Forecasts are labeled as forecasts, illustrative calculations as hypothetical, and the article does not constitute personalized legal, medical, or investment advice.