Cost-of-Living Support: Why the Delivery System Matters as Much as the Budget
Read the IMF's October 2026 cost-of-living analysis with care. Compare targeted transfers, broad price support, eligibility gaps and real household relief.
A government announces a large support package as essential prices rise. The headline gives the total budget, but a household wants to know something more concrete: will help arrive, how much will it cover, and what must the household do to receive it?
Those questions connect policy design with payment infrastructure and data quality. A carefully targeted benefit can miss people when records are incomplete. A broad price subsidy can reach people quickly while spending a large share of its budget on households that need less help.
The IMF's October 2026 World Economic Outlook, released October 13, makes cost-of-living responses a timely subject. This guide examines the mechanism and an original budget example. It does not describe a specific country's benefit entitlement.
What the new IMF report says
The IMF projects global growth of 3.1% in 2026 and 3.4% in 2027, with headline inflation of 4.7% and 4.1% respectively. Its statistical information cutoff is October 1, 2026. These are global projections, not a forecast for an individual household's expenses.
In its cost-of-living analysis, the report favors temporary, targeted income support for vulnerable households while preserving price signals. It finds that price-suppressing measures can require substantially more fiscal resources in the examined comparisons. That conclusion is evidence about policy tradeoffs, not a guarantee that every existing transfer system reaches every eligible person.
The remaining analysis is a worked explanation of why coverage and delivery must be assessed alongside a budget headline. Its fictional population and payments are not IMF estimates.
Distinguish the policy instruments
A transfer gives recipients money. A price subsidy changes the amount paid for an eligible good or service. A tax reduction changes a tax component, while a price cap constrains prices and may create obligations elsewhere. Their incidence and financing can differ.
A universal payment and a targeted transfer are both cash instruments. Comparing them is useful for understanding budget concentration, but it is not the same experiment as comparing a transfer with a fuel subsidy. Keep the mechanism clear before drawing conclusions.
| Instrument | Immediate channel | Question to investigate |
|---|---|---|
| Targeted transfer | Payment to selected recipients | Who is missed or wrongly included? |
| Universal payment | Payment to a broad eligible population | How much reaches households with greatest need? |
| Unit price subsidy | Lower price for eligible consumption | Who consumes the subsidized units? |
| Price cap | Limit on an allowed price | Who bears the cost and how is supply affected? |
Some measures can be combined. A temporary intervention may be justified by constraints that do not appear in a simplified model. Evaluation should state those constraints instead of pretending one policy label settles the question.
Work a fixed-budget example
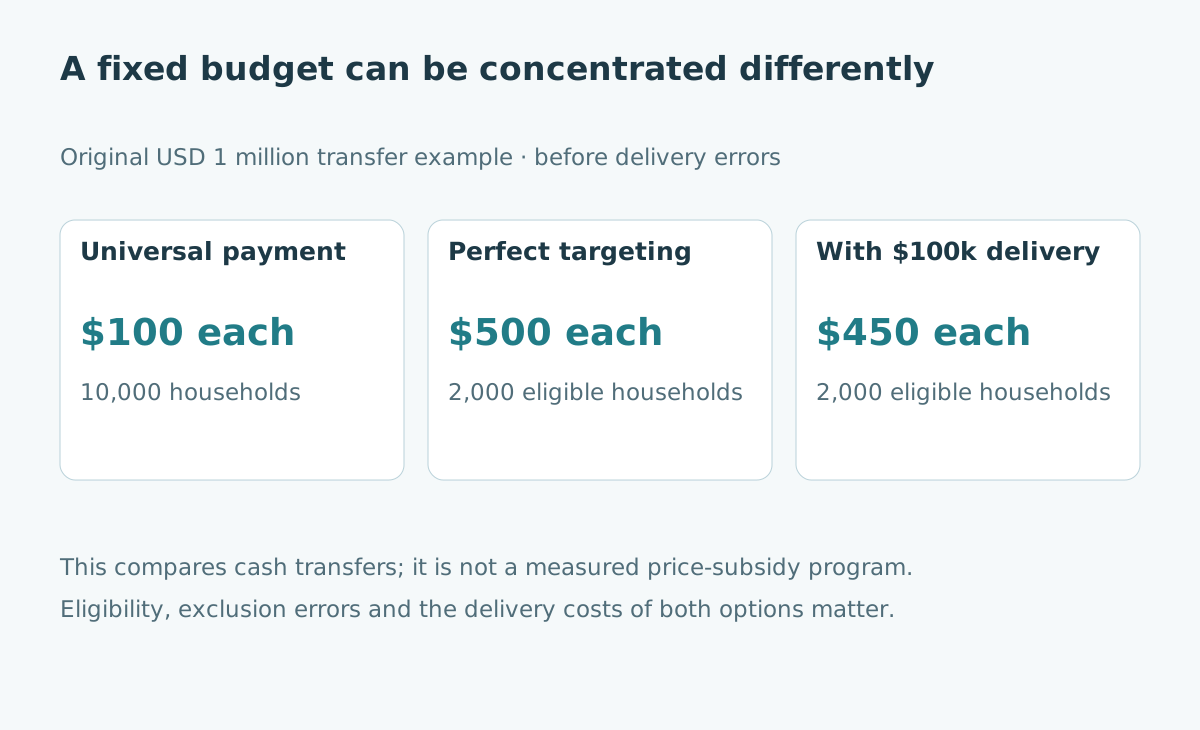
Assume an invented community of 10,000 households, of which 2,000 satisfy a defined need criterion. A $1 million budget could fund a $100 universal payment to every household. If it went only to the 2,000 eligible households, it could fund $500 each before delivery costs.
The arithmetic shows concentration, not fairness by itself. The criterion must be appropriate, the records sufficiently current, and access practical. A household just outside a threshold may still face hardship; a household inside the records may no longer need support.
| Synthetic design | Recipients | Payment each | Total before delivery costs |
|---|---|---|---|
| Universal transfer | 10,000 | $100 | $1,000,000 |
| Perfectly targeted transfer | 2,000 | $500 | $1,000,000 |
| Targeted with $100,000 delivery cost | 2,000 | $450 | $1,000,000 including delivery |
The third row separates the payment budget from administration. It does not assume that universal delivery is free. A proper comparison includes the delivery costs of both alternatives and the value of reaching people on time.
Count exclusion and inclusion errors
Suppose the targeting process misses 300 of the 2,000 eligible households. Eligible coverage is then 1,700 / 2,000 = 85%. If it also pays 200 ineligible households, total recipients become 1,900. Reporting only “1,900 households reached” conceals who was missed.
These are two different error rates with different denominators. Exclusion is measured against the eligible population; an inclusion share can be measured as ineligible recipients divided by all recipients. State the definition, because policy discussions sometimes use the same word for different calculations.
Missing an eligible household may be especially serious when the shock is immediate. Build correction and appeal routes that people can actually use. A sophisticated model is less helpful if its denial cannot be explained or corrected.
See why consumption patterns matter
A unit subsidy gives more absolute support to someone buying more units, unless the design includes a limit or tier. In a toy example, a $0.10 subsidy per unit gives $10 to a household consuming 100 units and $50 to one consuming 500 units.
This does not prove that the larger consumer is richer. Household size, disability, location, heating needs and access to alternatives can change consumption. It shows why a budget analysis needs actual distributional evidence rather than assuming that a lower unit price gives equal relief.
A policy can preserve a basic allowance and price additional consumption differently, but that introduces further design and delivery questions. Define which need the instrument is intended to address before optimizing its apparent cost.
Treat delivery as part of policy
A payment program needs identification, eligibility updates, accessible enrollment, a payment route and an exception process. People without a particular device or bank account should not disappear from the analysis simply because they are harder to reach digitally.
Measure time from eligibility to usable funds, failed payments, unresolved appeals and the cost of applying. Compare these outcomes across relevant groups. A transfer marked “sent” may still be unavailable to its intended recipient.
The 2026 UK Green Book emphasizes assessing costs, benefits, risks and distributional effects in appraisal. It is UK public-sector guidance, not an international benefits rule; its structured comparison is useful context for this worksheet.
Read the next support announcement critically
Ask for the budget period, funding source, target population, expected payment, delivery timetable and evaluation plan. Separate announced, authorized, paid and received amounts. These stages can have different totals.
As a self-check, a program says it covered 90% of registered applicants. Does that establish 90% coverage of eligible households? No. Eligible nonapplicants may be missing from the denominator. The registration process itself may be a barrier.
For household-level interpretation, see CPI and personal cost of living. A macroeconomic inflation number and a household's relief needs answer different questions.
Sources and scope
- IMF World Economic Outlook, October 2026: projections and cost-of-living policy findings.
- HM Treasury: The Green Book 2026: appraisal and distributional analysis context.
Checked October 22, 2026. Household counts, payments, subsidy rates and delivery errors above are synthetic, and no local program eligibility is implied.