A 95% Recycling Recovery Claim Can Still Return Only Half the Metal
Decode critical mineral recycling claims with collection rates, process recovery, output quality, and an original material balance showing the real denominator.
A recycling process recovers 95% of a valuable metal. That sounds close to a closed loop. But 95% of what? Material collected at the factory gate, metal entering the extraction step, or metal contained in all products reaching the end of their lives?
Those denominators can produce very different answers. A technically strong recovery process can coexist with weak collection, sorting losses, or output that fails the buyer's specification. The useful question is how much qualified material returns to use across the whole chain.
Critical minerals make this distinction increasingly important. Supply security depends on actual usable material, not only installed recycling capacity or a favourable laboratory percentage. This article builds a transparent material balance and shows where an additional investment produces the largest gain.
What the 2026 evidence adds
The IEA's Global Critical Minerals Outlook 2026, published July 16, examines supply security and diversification. Its executive summary describes smelters as processing hubs that can recover critical by-products and support scrap recycling. Recycling therefore belongs inside a larger supply-chain discussion rather than outside it.
The Global EV Outlook 2026 battery chapter explains a second constraint: production scrap remains important feedstock, while end-of-life battery availability lags rapidly growing deployment. It says most recently deployed batteries remain in use, and that recycling capacity exceeds available feedstock globally.
These observations do not establish a recovery rate for a particular plant. They explain why capacity, collection, and process yield must be measured separately. A facility can have excellent equipment and still lack the right material to run it economically.
Choose a functional unit before comparing projects
A functional unit defines what the calculation describes. For this exercise, use one annual cohort containing 1,000 tonnes of discarded products, with 25 tonnes of a named target metal inside them. These are invented quantities, not an estimate of battery or electronics composition.
Track that same metal throughout the calculation. Do not switch midway from total product mass to black mass, chemical compound mass, or saleable product mass without conversion. A tonne of a metal-containing compound is not a tonne of elemental metal.
Likewise, keep production scrap separate from post-consumer discarded products. Scrap generated inside a manufacturing process may be easier to collect and characterize than material spread across thousands of owners. A performance figure from one stream should not silently describe the other.
The simplest useful spreadsheet includes a stream name, total dry mass where applicable, target-metal concentration, target-metal content, and destination. It should state the period and whether stock accumulated or was drawn down during that period.
Worked balance: follow the metal through four stages
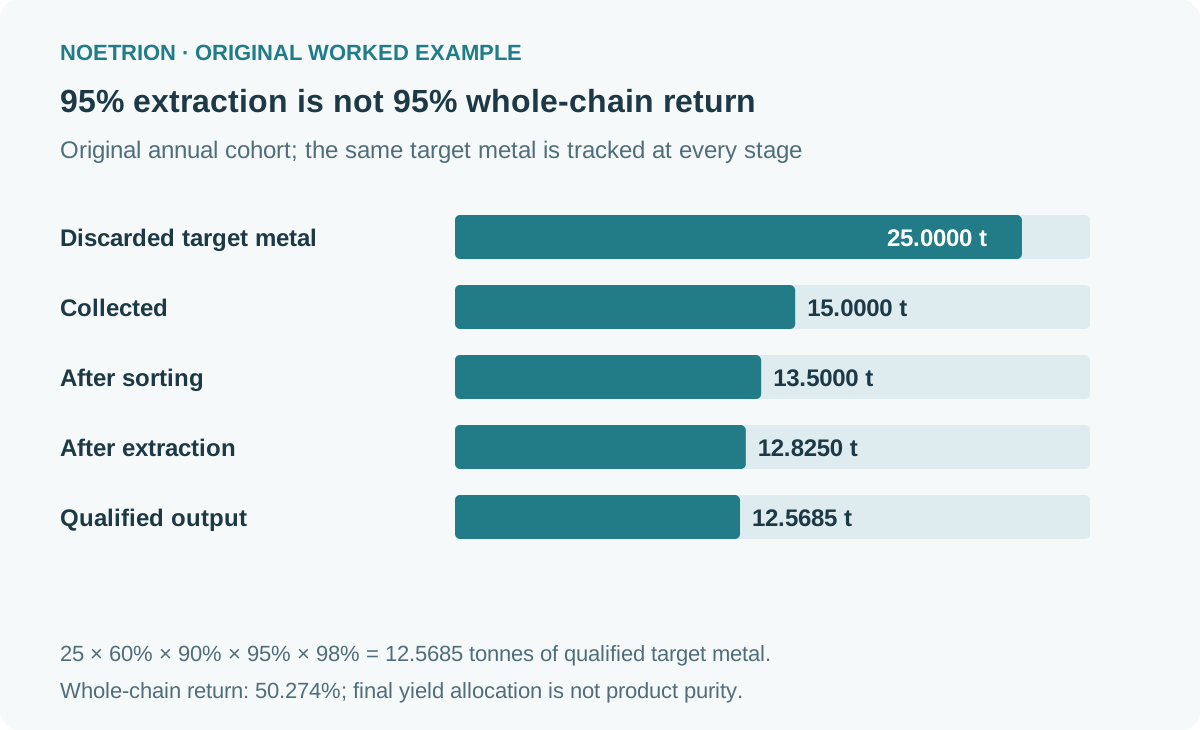
Assume collection captures 60% of the target metal in discarded products. Sorting retains 90% of that collected metal in the stream sent to extraction. Extraction recovers 95% of the metal entering that step. Finally, 98% of the recovered metal content ends up in product meeting the chosen specification.
| Stage | Stage retention | Target metal remaining | Target metal leaving the tracked route |
|---|---|---|---|
| All discarded products | Starting point | 25.0000 t | — |
| Collection | 60% | 15.0000 t | 10.0000 t |
| Sorting and preparation | 90% | 13.5000 t | 1.5000 t |
| Extraction | 95% | 12.8250 t | 0.6750 t |
| Qualified output allocation | 98% | 12.5685 t | 0.2565 t |
The extraction step genuinely recovers 95% of its incoming target metal. Yet the full-chain qualified return is:
25 × 0.60 × 0.90 × 0.95 × 0.98 = 12.5685 tonnes.
Relative to the original 25 tonnes, this is 50.274%. There is no contradiction. The percentages use different boundaries.
The last 98% is a yield allocation, not a claim that the final product is 98% pure. Purity would describe concentration within the product and requires its own measurement. Keeping these concepts separate avoids another common ambiguity.
Check closure before celebrating a high yield
The tracked amounts must reconcile. Qualified output of 12.5685 tonnes plus stage departures of 10, 1.5, 0.675, and 0.2565 tonnes totals 25 tonnes. That is the balance closure for the synthetic case.
In an operating plant, a discrepancy can reflect weighing error, sampling error, moisture assumptions, unmeasured streams, or changing inventory. It is not automatically fraud or a process loss. Investigate the discrepancy before assigning it a convenient explanation.
Also distinguish departure from the tracked route from permanent loss. A sorting reject may enter another recovery route. Off-spec material might be reprocessed later. If so, record the destination and avoid crediting the same metal twice in the same reporting period.
The exercise intentionally ignores intermediate inventory changes so the arithmetic is visible. A real annual balance needs opening and closing stocks. Otherwise, a plant can appear to improve recovery simply by processing material accumulated in an earlier year.
Which proposed improvement returns more metal?
A useful next question is which stage offers the largest practical opportunity. Compare two independent upgrades against the baseline, leaving all other assumptions unchanged.
| Scenario | Qualified target metal | Gain over baseline | Whole-chain return |
|---|---|---|---|
| Baseline: collection 60%, extraction 95% | 12.5685 t | — | 50.274% |
| Collection rises to 80% | 16.7580 t | 4.1895 t | 67.032% |
| Extraction rises to 99% | 13.0977 t | 0.5292 t | 52.3908% |
The collection upgrade returns about 7.92 times as much additional qualified metal as the extraction upgrade in this example. That does not prove collection is always the cheaper investment. It shows that the most impressive equipment improvement is not necessarily the largest system improvement.
If both upgrades cost the same, the larger physical gain would be attractive on a simple tonnes-returned basis. If collection costs much more, the ranking can change. Compare incremental cost per additional qualified tonne, then examine service, safety, environmental, and supply-security objectives separately.
An extraction technology can still be strategically valuable if it recovers a material that older methods do not capture at all. That is a different claim from improving the yield of an already recovered metal and deserves its own balance.
Output quality is part of the result
The IEA PVPS Task 12 April 2026 recycling report summary discusses material recovery, process yields, and output purity using commercial and pilot-scale data from the United States and Europe. It also identifies gaps in electricity consumption data, material-quality characterization, and consistent system boundaries.
That is a useful reporting lesson even when comparing a different recycling stream. Two plants producing the same mass may deliver materials with different usefulness to the next buyer. A contaminated output may need further treatment, while a clean output may replace a higher-value input more directly.
Ask for a named specification and evidence that the output meets it. Then ask whether a buyer has accepted that material in the intended application. A claimed market for output is stronger when supported by an actual qualification process rather than a broad statement that the material is recyclable.
Build a recovery claim worksheet
A transparent comparison makes the boundary visible before displaying the headline percentage. Use the same period and target material in every row.
| Worksheet field | What to record |
|---|---|
| Input population | Production scrap, collected waste, or all discarded products |
| Target material | Named element or defined compound, with conversion basis |
| Collection | Quantity available, quantity captured, and estimation method |
| Stage yields | Separate retention for sorting, extraction, and qualification |
| Product quality | Specification, assay method, and accepted application |
| Other destinations | Rejects, residues, reprocessing, exports, and inventory |
| Resource use | Energy, water, and reagents using a stated functional unit |
| Uncertainty | Sampling, weighing, concentration, and inventory limitations |
This worksheet should travel with a recovery claim. If a supplier cannot provide a complete balance, preserve the partial result and name its boundary rather than forcing it into a whole-chain percentage.
Capacity is an option; feedstock turns it into production
A new recycling line's annual nameplate capacity indicates what it might process under defined conditions. It does not establish annual feedstock availability, actual utilization, or qualified output. The distinction is especially important when products remain in service for many years.
A credible business case therefore models the material arriving each year, its composition, competing claims on it, and the plant's ability to process variable batches. It should not fill every future operating hour with material that has not yet been discarded or contracted.
For buyers and policymakers, the most useful comparison is a chain of evidence: available feedstock, realistic collection, measured process yields, qualified output, and actual destinations. A 95% figure can be excellent within its boundary. The task is to show that boundary clearly enough that readers do not mistake one successful step for the entire circular system.
For the energy boundary of a different technology, the battery sizing worksheet also separates a headline rating from usable output.
Sources and scope
- IEA, Global Critical Minerals Outlook 2026, July 16, 2026; executive summary.
- IEA, Global EV Outlook 2026: Electric vehicle batteries, recycling feedstock and capacity context.
- IEA PVPS Task 12, Advances in Photovoltaic Module Recycling, April 2026; report summary reviewed.
Checked October 20, 2026. The cohort, metal content, yields, and upgrade scenarios are synthetic and are not performance claims about a named plant or technology.