The Transfer Fee Is Not the Transfer Cost: Compare Cross-Border Payments Properly
Compare international transfers using the recipient's final amount, exchange-rate margins, and usable arrival time, with a worked example and quote worksheet.
Educational analysis, not a personal investment or payment recommendation. Check the dated sources and the rules that apply in your jurisdiction.
A transfer advertised with no fee can deliver less money than one with an obvious charge. The difference may sit in the exchange rate, an intermediary deduction, or a receiving fee. A payment described as “instant” may also reach the receiving institution before the recipient can use it.
These are comparison problems, not reasons to assume every provider is misleading. The remedy is to hold the comparison constant: the same sender budget, destination, receiving method, quote time, and definition of arrival. Then compare the amount the recipient can actually use.
What the current policy discussion tells us
An August 26, 2026 Federal Reserve research note reviews cross-border payment efforts using annual monitoring data, including 2025 observations. It distinguishes payment processing between institutions from the receiving institution's release of funds to the customer. It also warns that changes in the sampled payment providers can complicate comparisons across years.
In July 8, 2026 remarks, the FSB's Deputy Secretary General emphasizes corridor-specific frictions and the importance of foreign-exchange markets. The remarks are a speaker's assessment, not a new global consumer guarantee.
These sources support looking beyond a single fee or speed claim. The cited monitoring sources describe earlier reporting periods, not a newly measured October outcome. The numerical comparison below is fictional, so the calculation can be inspected independently of changing provider prices.
Define what is being compared
A fair quote comparison begins with a small set of fixed conditions. A $500 principal with a fee added on top is not the same budget as $500 including all sender charges. A cash-pickup service is not identical to a bank deposit, particularly if the recipient must travel to collect it.
| Comparison condition | Record explicitly | Why a mismatch matters |
|---|---|---|
| Sender budget | Total amount debited, including known fees | Different budgets produce different recipient amounts |
| Destination | Currency and receiving location | Prices vary by corridor |
| Funding method | Account, card, cash, or other method | Funding charges and timing can differ |
| Receiving method | Account, wallet, or cash collection | Access and deductions can differ |
| Quote timestamp | Time, expiry, and whether the rate is locked | Exchange rates and offers change |
| Arrival definition | Usable by the recipient | Processing completion may precede availability |
Keep the screenshot or written quote, but do not rely on a headline banner alone. Read the transaction-specific details, especially where fees depend on amount, payment method, or an introductory offer.
A comparison remains incomplete if a receiving deduction is unknown. Mark it unknown rather than zero. If it cannot be estimated reliably, compare a range and explain what information would resolve it.
See how a zero fee can cost more
Assume a fictional total sender budget of $500 and a reference exchange rate of 16,000 recipient-currency units per dollar. This reference is a calculation benchmark, not a claim that a customer could trade at that rate. Every quote below is invented and available at the same hypothetical moment.
Provider A charges no explicit sender fee but converts at 15,600. Provider B deducts a $5 sender fee from the $500 budget and converts the remaining $495 at 15,920. Provider C deducts $3, converts $497 at 15,840, and then a known receiving charge removes 30,000 recipient units.
| Fictional provider | Sender fee within $500 | Amount converted | Conversion rate | Receiving deduction | Recipient gets |
|---|---|---|---|---|---|
| A | $0 | $500 | 15,600 | 0 | 7,800,000 |
| B | $5 | $495 | 15,920 | 0 | 7,880,400 |
| C | $3 | $497 | 15,840 | 30,000 | 7,842,480 |
The reference value of $500 is 8,000,000 units. Relative to that benchmark, A's shortfall is 200,000 units, B's is 119,600, and C's is 157,520. Expressed as percentages of the benchmark, the modeled total costs are 2.50%, 1.495%, and 1.969%, respectively.
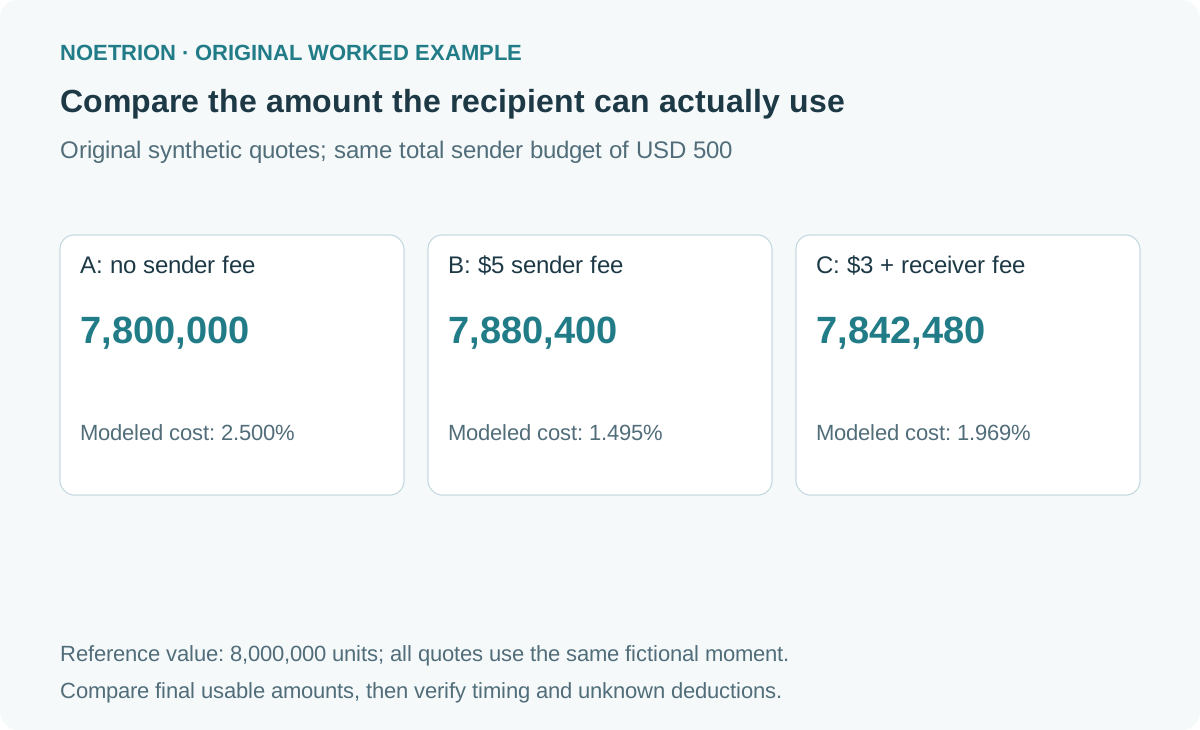
Provider B delivers 80,400 units more than A despite its visible fee. That is the difference a fee-only comparison would miss.
Calculate the FX margin without double counting
For a quote expressed as recipient units per sender dollar, a simple rate discount is:
FX margin = 1 − quoted conversion rate / reference conversion rate
A's rate margin is 2.5%; B's is 0.5%; C's is 1%. But those percentages alone do not include all the explicit charges. The total-cost calculation instead compares the final recipient amount with the reference value of the complete sender budget.
Do not add a displayed “total cost” to an FX margin if the provider's total already includes that margin. Likewise, do not subtract a fee twice when it has already been deducted from the converted principal. Write the cash path in order: total debit, amount available for conversion, conversion, receiving deductions, final usable amount.
The World Bank's Remittance Prices Worldwide methodology explicitly distinguishes transfer fees from exchange-rate margins. It describes the database as a dated snapshot and notes that some recipient-side charges may not be captured. Use such datasets for context, then obtain an actual quote for your transaction.
The benchmark rate also needs a timestamp and a consistent direction. If one rate is quoted as dollars per local unit and another as local units per dollar, invert one before comparing. A small spreadsheet error in the direction of the rate can overwhelm the real price difference.
Measure arrival at the point of use
Consider a fictional transfer initiated at 09:00 UTC. It reaches the receiving bank at 09:12, but the recipient's funds become usable at 11:30. The institutional leg takes 12 minutes, the release leg another 138 minutes, and the total experience is 150 minutes.
Calling the whole experience “12 minutes” would use the wrong endpoint. The Federal Reserve note makes this distinction in its discussion of wholesale monitoring; the same endpoint question is useful when designing a customer-facing comparison. It does not imply that every retail provider uses the same reporting convention.
| Timestamp | Fictional observation | What it measures |
|---|---|---|
| Initiated | 09:00 UTC | User submits a complete payment instruction |
| Receiving institution reached | 09:12 UTC | Institutional processing endpoint |
| Funds usable | 11:30 UTC | Recipient can spend or withdraw |
| Total elapsed time | 150 minutes | End-user availability measure |
For a future payment, ask what can delay the estimate: funding settlement, cut-off times, weekends, additional information requests, or the recipient's access method. Keep an estimated arrival time separate from a contractual guarantee. If the money must be available by a particular deadline, uncertainty matters alongside the average advertised speed.
Read global targets as targets
The FSB's original cross-border payment targets address cost, speed, access, and transparency across wholesale, retail, and remittance segments. Most targets use an end-2027 horizon; the remittance cost target follows a 2030 horizon.
Those dates do not mean every provider has already achieved the target, or that an individual transfer is guaranteed a particular price. Nor should wholesale, retail, and remittance measures be treated as interchangeable. A metric that tracks a service offering may answer a different question from a transaction-weighted measure of what customers experienced.
When reading a performance chart, identify the segment, geography, observation year, sample, and endpoint. A global average can improve while your corridor remains expensive. A corridor can also look cheaper because the sampled services changed. These possibilities do not invalidate monitoring; they define what the monitoring can support.
For a personal decision, the transaction-specific quote remains the closest evidence. For policy analysis, retain the broader dataset and its methodology. Each serves a different purpose.
Build a quote log that survives promotional pricing
Capture at least two comparable quotes near the intended transfer time. Record both the first-transfer promotion and the regular price if the provider discloses it. For a repeated payment, a one-off discount may matter less than the ongoing cash path.
Add the final amount received after the transfer. This creates a reconciliation record: was the difference caused by an expired quote, a changed rate, a known deduction, or something unexplained? A log is especially helpful when budgeting recurring tuition, family support, or supplier payments.
For a small business, keep the payment reference with the invoice and record who bears receiving charges under the agreement. A cheaper transfer that leaves an invoice underpaid can create extra work or a contractual dispute. Compare the cost of satisfying the actual payment obligation, not merely the largest number on a quote screen.
Also consider access. A recipient amount that looks attractive may be less useful if collecting it requires substantial travel or if withdrawal limits prevent timely use. Those burdens may not belong in the provider's FX margin, but they belong in your decision.
A short exercise before the next transfer
Choose a fixed total budget, then calculate the final recipient amount for two quotes. Label unknown charges, check the quote expiry, and write the promised availability endpoint. Repeat the calculation after removing any introductory discount where regular pricing is available.
If one quote has an unknown receiving charge, calculate the charge at which it stops being the better option. That break-even deduction turns a vague uncertainty into a specific question for the provider. Keep the comparison local to the actual corridor and amount.
The aim is not to find a permanently cheapest brand. It is to understand the current transaction well enough to choose with evidence. The fee is visible; the full cash path is what determines the outcome.
The payment verification guide covers a separate question: whether account-name checks support the intended transfer.
Sources and verification notes
- Federal Reserve FEDS Note, August 26, 2026: monitoring interpretation, historical observations, and institutional versus beneficiary legs.
- FSB Deputy Secretary General remarks, July 8, 2026: corridor and FX-market frictions; speaker's views.
- World Bank RPW methodology: fees, FX margins, snapshot limits, and recipient-charge caveats.
- FSB targets, October 13, 2021: target framework and dates.
Checked October 20, 2026. All provider quotes and timestamps are synthetic and independently recalculated. No current provider price, newly released 2026 KPI result, or jurisdiction-specific consumer remedy is asserted.