Cuffless Blood Pressure Wearables: Read the Validation Before the Number
Learn how to evaluate cuffless blood pressure wearables, spot calibration drift, and read validation evidence without confusing convenience with accuracy.
This guide explains research and technology. It does not provide diagnosis or treatment, and regulatory status should be checked with the relevant authority.
A watch displays a blood pressure number. It has units, a timestamp, and a reassuringly precise appearance. Yet the useful question is not how neatly the number fits on a screen. It is whether the device can follow a person's blood pressure when it changes, under the conditions in which that number will be used.
That question has become more concrete. The US Food and Drug Administration issued a draft on cuffless blood pressure clinical performance testing on January 23, 2026. The document remains labelled draft and not for implementation in the version reviewed for this article. It is a proposal for evaluating evidence, not an announcement that every blood pressure watch has been validated.
This guide explains how to interrogate a product claim and includes an original numerical example of a misleading average. It is about evidence literacy, rather than selecting a device for diagnosis or changing treatment.
The 2026 development: testing the intended use
The FDA draft distinguishes device uses such as resting spot checks, continuous measurements, autonomous readings, and measurements during sleep or movement. Its proposed testing framework separates static performance, stability after initialization, and ability to follow pressure changes. The document also recommends evaluating applicable tests independently, rather than pooling their results.
These distinctions matter because a successful resting demonstration does not answer every question a buyer might have. A seller could show a watch matching another instrument immediately after setup, while the buyer imagines it will reliably track changes weeks later. The missing evidence lies between those two situations.
US regulatory status is also a separate check. In its September 16, 2025 safety communication, the FDA warned against unauthorized devices, including wearable software features claiming to measure blood pressure. It recommended an authorized device appropriate to the user's needs. That is a US regulatory statement; other countries have their own routes and registers.
A sensor signal is not automatically a pressure measurement
Some devices derive estimates from signals related to blood flow or pulse timing. A photoplethysmography signal, for example, tracks optical changes associated with blood volume. A model then maps its inputs to the output displayed as pressure. The FDA draft asks manufacturers to explain sensors, derived parameters, calibration inputs, signal quality checks, and how the algorithm produces its outputs.
The distinction is practical. A signal may change when the strap shifts, when the measurement position changes, or when the person's physiology differs from the model's training examples. A product's documentation should explain which conditions are supported and which cause the device to withhold a result. A blank reading can sometimes be more honest than a confident number from a poor signal.
For readers, this suggests a useful question: what must remain true for this estimate to be valid? Ask that before asking whether the graph looks smooth. Smoothness is a display property. Accuracy is an empirical relationship between the device and an appropriate reference.
Calibration can create a convincing first impression
Calibration supplies the system with information that anchors its output. It may include a known cuff measurement or personal inputs. That can improve agreement at setup without establishing agreement across future conditions.
Imagine weighing a parcel on a scale that you have just adjusted to show the correct weight of one reference box. Matching that box proves something, but it does not prove that the scale handles lighter boxes, heavier boxes, or tomorrow's temperature. The same logical distinction applies to evaluating a calibrated estimator, although blood pressure measurement has substantially more physiological complexity.
Three questions help organize a product review:
| Evidence question | What to request | What it prevents you assuming |
|---|---|---|
| Agreement after setup | Results soon after initialization | That a demonstration proves long-term performance |
| Stability over time | Results across the labelled calibration window | That today's calibration lasts indefinitely |
| Response to change | Results when reference pressure moves above and below setup | That a stable estimate reflects stable physiology |
| Conditions and users | Supported population, position, and use case | That findings generalize to every wearer |
This table is an editorial reading aid, not a substitute for a clinical validation protocol.
Worked example: a perfect mean can hide failed tracking
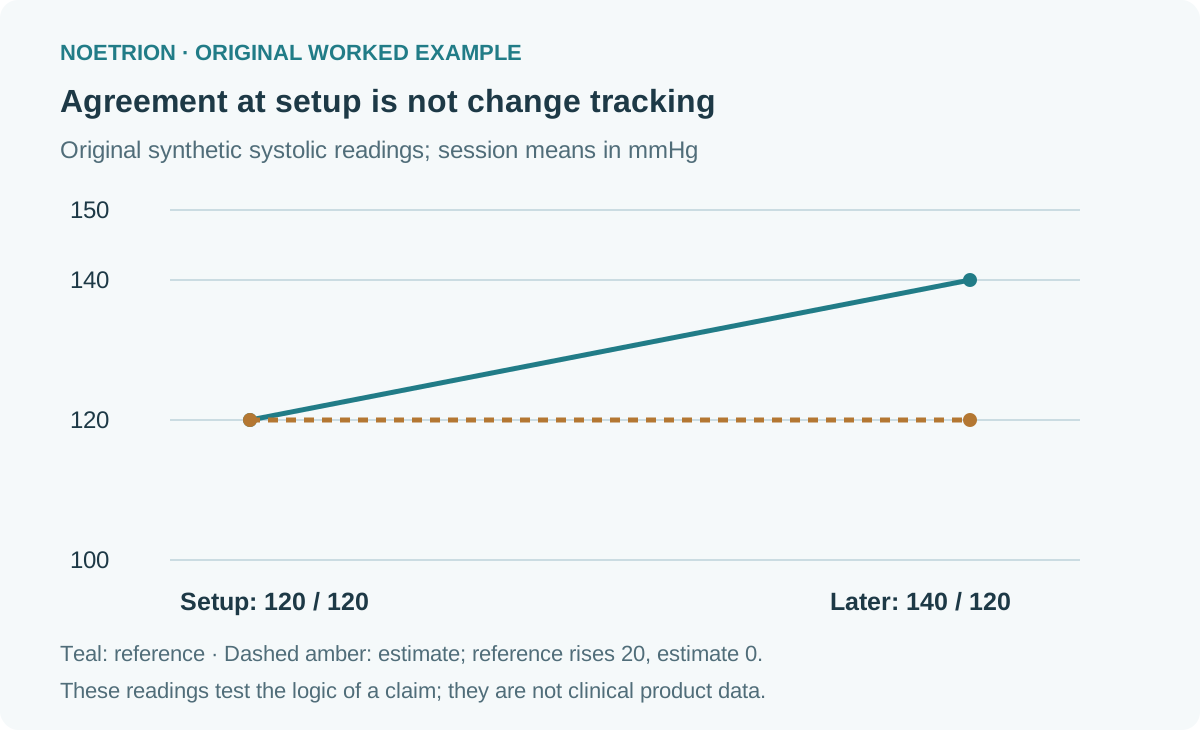
The following dataset is entirely synthetic. It represents six paired systolic readings, in mmHg, arranged into two hypothetical sessions. The reference column is an invented comparison value, not a recommendation about clinical thresholds.
| Session | Reference | Wearable estimate | Estimate minus reference |
|---|---|---|---|
| Setup 1 | 118 | 120 | +2 |
| Setup 2 | 120 | 120 | 0 |
| Setup 3 | 122 | 120 | −2 |
| Later 1 | 138 | 120 | −18 |
| Later 2 | 140 | 120 | −20 |
| Later 3 | 142 | 120 | −22 |
At setup, the mean error is zero. Later, the mean error is −20. The reference session mean rises from 120 to 140, but the wearable session mean remains 120: it captures none of the 20 mmHg change in this constructed example.
Across all six readings, the mean error is −10. Now imagine adding an equally sized hypothetical lower-pressure session with errors of +18, +20, and +22. The pooled mean error over all nine readings becomes zero again. Large errors in opposite directions cancel. That arithmetic does not make any individual estimate more useful.
Report spread and missing readings alongside averages
A mean summarizes direction, while the spread describes variation. In the six-row example, the absolute errors total 64, giving a mean absolute error of approximately 10.67 mmHg. The sample standard deviation of signed errors is approximately 11.10 mmHg. These summaries expose the problem more clearly than the setup mean alone.
Even those statistics are not a complete validation. Six invented observations cannot establish performance in a population. Repeated readings from one person are not interchangeable with independent participants, and an evaluation must account for its design. A reader should resist treating a large count of readings as a large count of people.
Missing measurements need their own denominator. If a device returns 70 readings from 100 planned attempts, the reported error among those 70 does not tell you what happened during the other 30. Were failures concentrated during movement, poor circulation, or another relevant condition? This is a question for the study report, not a reason to invent an answer.
The FDA standards database lists partial recognition of IEEE 1708, including exclusions related to change testing and testing over time. A claim to follow a named standard therefore needs its specific scope, not just the standard number.
A useful product comparison records both agreement and availability. A device that withholds unreliable estimates presents a different trade-off from one that always displays a value. The appropriate trade-off depends on the intended use and the quality of the evidence behind it.
Build a one-page evidence worksheet
When reviewing a wearable, save the exact model and software version. Product families may share a brand name while using different algorithms or indications. Capture the source link and access date so that a later software change does not silently replace the evidence you reviewed.
| Worksheet field | Example of a useful entry |
|---|---|
| Exact product and feature | Model identifier, firmware, pressure feature name |
| Regulatory claim | Jurisdiction, database entry, and exact intended use |
| Calibration | Required inputs, supported interval, and setup conditions |
| Participants | Number of people, age range, relevant subgroup coverage |
| Reference method | Named comparator and timing of paired readings |
| Change and stability evidence | Separate results and follow-up duration |
| Failed attempts | Planned attempts, valid results, and exclusion reasons |
| Evidence boundary | Conditions or populations not evaluated |
Do not fill an empty field with a marketing inference. Mark it unavailable and ask the supplier for the underlying report. That makes the uncertainty visible to everyone making the decision.
What a sensible decision looks like
For a curious consumer, an evidence worksheet can help separate a wellness feature from a feature intended for medical decisions. For a workplace purchasing team, it prevents a visually attractive dashboard from becoming the only acceptance criterion. For a student, the example illustrates why model evaluation needs more than one summary metric.
If care depends on an accurate pressure measurement, the FDA communication advises discussing an appropriate authorized device with a health care provider. An unexplained mismatch should prompt verification through the care team's recommended measurement approach, rather than averaging two incompatible devices or adjusting medication from a wearable estimate.
The underlying lesson is durable: test the claim in the setting where it matters. A reading immediately after calibration, a month-long trend, and a response to a real physiological change are three different claims. Good documentation tells you which one has been established.
The diagnostic tests and base rates guide offers another example of why a headline metric needs a denominator.
Sources and scope
- FDA, cuffless clinical performance testing draft, issued January 23, 2026; reviewed October 14, 2026. Proposed recommendations, not final implementation guidance.
- FDA, unauthorized blood pressure device safety communication, September 16, 2025.
- FDA recognized standards entry for IEEE 1708, including limitations of recognition.
All readings, worksheets, and numerical interpretations in the worked example are original synthetic teaching material. No product was clinically tested for this article.