Revenue Can Grow While Customers Leave: Freeze the Cohort Before Calculating Retention
Calculate customer, gross revenue and net revenue retention from one fixed cohort. Separate expansion from new sales and avoid misleading dashboard denominators.
The sales chart is climbing, yet support keeps hearing from customers who have cancelled. A growing business can experience both at once. New customers can replace departed revenue, and a handful of expanding accounts can hide a decline in the number of customers who remain.
The first analytical task is to decide which population belongs in the calculation. Retention is a question about a starting group followed over time. If new arrivals enter that group halfway through the measurement, the answer changes into something else.
Public company disclosures provide useful examples of why definitions matter. In its March 2026 quarterly filing, Freshworks describes net dollar retention using starting and ending ARR for the same customer population. Its definition also discusses expansion, contraction and attrition. This is one issuer's stated method, not a universal accounting definition. The tutorial below uses its own explicitly defined monthly recurring revenue example, with invented customers and amounts.
Freeze the starting population
Imagine five customers present at the beginning of a measurement interval. Their starting monthly recurring revenue totals 1,000 monetary units. Keep those five identifiers in the cohort until the calculation is complete, including customers whose ending value becomes zero.
A sixth customer acquired during the interval belongs in total business growth, but not in this cohort's retention numerator. Otherwise the dashboard rewards acquisition while calling it retention.
Specify how a customer is identified. A contract, billing account, corporate group and person are different units. If two accounts merge, document how history is mapped so an administrative change does not masquerade as churn and acquisition.
Use a row-level bridge
Here is the complete original dataset. The ending figures use the same currency basis and recurring-revenue definition as the starting figures. There are no acquisitions, reactivations, temporary pauses or currency movements in this example.
| Starting customer | Starting MRR | Ending MRR | Interpretation |
|---|---|---|---|
| A | 400 | 800 | Expansion of 400 |
| B | 200 | 100 | Contraction of 100 |
| C | 200 | 0 | Churn of 200 |
| D | 100 | 100 | Unchanged |
| E | 100 | 100 | Unchanged |
| Existing cohort | 1,000 | 1,100 | Net increase of 100 |
| New customer F | Outside cohort | 300 | New sales, excluded from retention |
The business's ending total is 1,400, but the existing cohort's ending total is 1,100. Those two numerators answer different questions.
Calculate three distinct measures
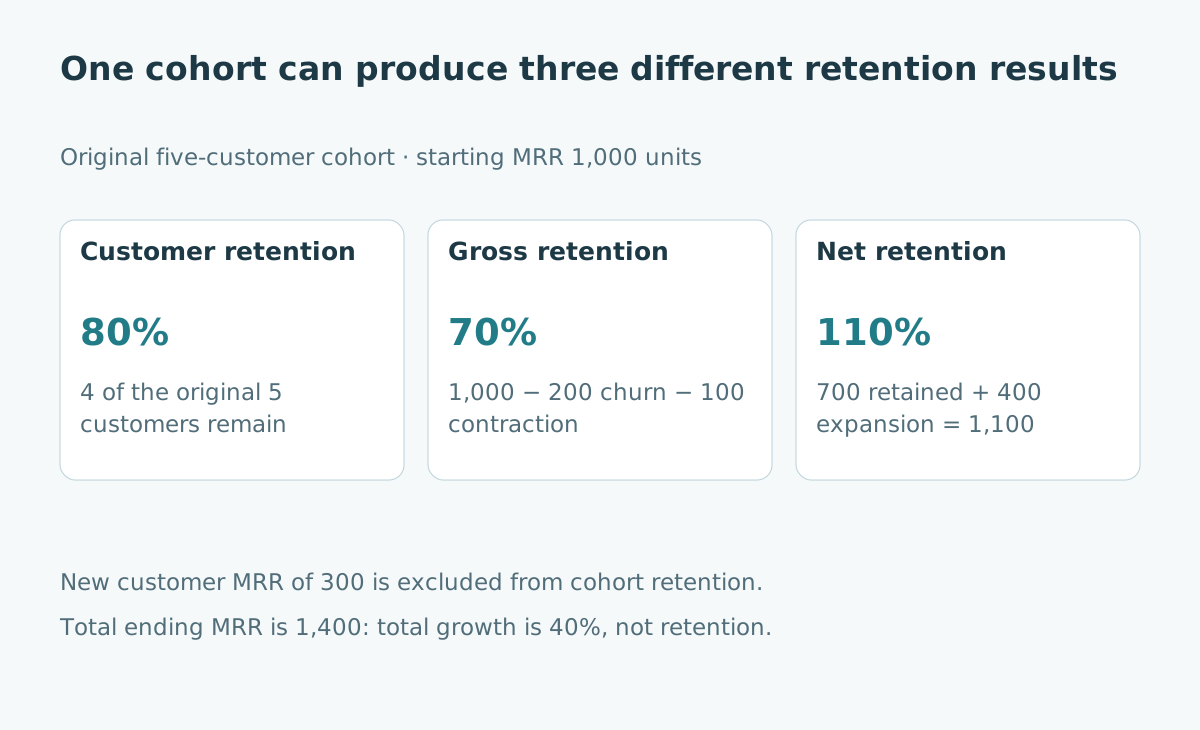
Define customer retention here as the share of starting customers with positive ending MRR. Four of five remain, so customer retention is 80%. This binary measure gives each customer equal weight, whatever its revenue.
Define gross revenue retention as starting MRR minus churned and contracted MRR, divided by starting MRR. For this dataset it is (1,000 − 200 − 100) / 1,000 = 70%. Expansion does not offset losses in this measure.
Define net revenue retention as ending MRR from the starting cohort divided by its starting MRR. It is 1,100 / 1,000 = 110%. The same result follows from adding expansion of 400 to the gross-retained 700.
All three results can be correct together. They describe different aspects of the same five rows.
Reconcile retention with total growth
Total starting MRR is 1,000. Total ending MRR is 1,400, including new customer F. Total MRR growth is therefore 40%, while the existing cohort grows by 10% and customer retention is 80%.
A dashboard showing only 40% growth can miss the departed customer. A dashboard showing only 110% net retention can miss both churn and contraction. A dashboard showing only 80% customer retention cannot reveal whether the retained accounts expanded enough to support the business.
| Measure under this article's definitions | Result | Included in numerator |
|---|---|---|
| Customer retention | 80% | Four surviving starting customers |
| Gross revenue retention | 70% | Starting value after losses, before expansion |
| Net revenue retention | 110% | Ending value of the starting cohort |
| Total MRR growth | 40% | All ending MRR, including new customer |
Do not rank one as the honest metric and dismiss the others. Present them together with their definitions and the underlying bridge.
Protect the denominator in the data pipeline
Build a cohort table at the starting date, then attach ending observations to those identifiers. Missing ending records require investigation. They should not vanish through an inner join.
A missing record might mean genuine churn, an extraction failure, an identifier change, or a migration to another billing system. Converting every unmatched row to zero without checking can overstate churn. Dropping every unmatched row can overstate retention.
Reconcile the starting cohort count and total before computing ratios. Keep a list of unmatched identifiers, duplicate mappings and unresolved cases. Publish an incomplete-data status when the evidence does not yet support a definitive result.
Separate run rates from cash and accounting revenue
MRR is a defined recurring-revenue run rate, not cash collected this month. A customer may pay annually, receive a credit, use consumption pricing, or owe an overdue invoice. Each situation can produce different cash, revenue and run-rate figures.
The SEC's financial statement guide explains the distinct roles of income and cash-flow statements. Keep that distinction when building a retention dashboard. A strong run-rate retention result does not establish timely collections, profitability, or available cash.
For usage-based products, choose a documented measurement window and explain seasonality. Do not compare one unusually busy month with a quiet month and attribute the entire difference to durable customer expansion.
Check the concentration behind the average
In the fictional cohort, customer A alone expands by 400. Remove that expansion while leaving every other row unchanged, and ending cohort MRR would be 700, giving 70% net retention. The business's apparently strong 110% result depends on one account's growth.
That sensitivity is a reason to inspect concentration, not a reason to erase the account. Show the largest contributors and segments such as tenure or product, using sufficiently large groups and consistent definitions.
A customer-success team might prioritize the reason for B's contraction and C's departure while verifying whether A's expansion is durable. The aggregate number cannot choose those actions without account-level context.
Turn the analysis into a repeatable review
Retain the cohort date, interval, identifier policy, currency treatment, recurring-revenue definition and handling of reactivations. Version the calculation when any definition changes, and explain whether earlier periods were restated.
At the review, walk from starting revenue through churn, contraction, expansion and new sales. Ask who owns each unresolved data exception and each material commercial change. The worksheet becomes useful when a reader can reproduce the ratio and understand what would change it.
Growth and retention belong in the same conversation. Freezing the cohort lets that conversation distinguish new sales from continuing relationships, and it makes a rising chart more informative about the business underneath.
Sources and further reading
- Freshworks Form 10-Q, quarter ended 31 March 2026: issuer-specific retention definition, checked 24 October 2026.
- SEC guide to financial statements, checked 24 October 2026.
- Related: data contracts and profit versus operating cash flow.