Data Center Cooling: Why a Better PUE Can Hide a Bigger Water Bill
Compare data center cooling options with PUE, WUE, absolute water use, and a worked scenario that separates site water from electricity-related impacts.
A data center announces a lower power usage effectiveness ratio. That sounds like an environmental win. It may be one—but the announcement does not yet tell you whether total electricity fell, whether water use rose, or whether the local water supply can comfortably support the operation.
AI infrastructure has made these distinctions commercially important. The IEA's data-center tracking page identifies its latest findings as of June 2026. As investment accelerates, cooling proposals deserve a close look at what each efficiency figure actually measures. A useful comparison starts with explicit measurement boundaries and equal computing requirements. IEA tracking page.
The practical question is not which acronym looks best in a presentation. It is which cooling configuration delivers the required computing service reliably while using acceptable amounts of electricity and water in the place where it operates.
PUE and WUE answer different questions
Power usage effectiveness, or PUE, divides total facility energy by IT equipment energy over a matched period. A PUE of 1.20 means the facility uses 1.20 units of energy for every unit assigned to IT equipment. It does not mean 20 percent of the facility's total electricity goes to cooling: the overhead fraction would be 0.20 / 1.20, approximately 16.7 percent, and overhead also includes other loads.
Water usage effectiveness, or WUE, divides site water use by IT equipment energy, commonly expressed in liters per kilowatt-hour. The U.S. Department of Energy defines these site-based metrics and explains that cooling water demand depends on heat loads and the efficiency of the heat-removal chain. DOE cooling-water guidance.
These ratios share a denominator but have different numerators. Neither measures useful computing output. An inefficient application could consume substantial IT energy while operating inside a facility with excellent infrastructure ratios.
Why cooling can shift the burden
An evaporative cooling tower removes heat partly by evaporating water. That physical mechanism can reduce reliance on other cooling equipment under suitable conditions, but the evaporated water must be replaced. A dry heat-rejection approach can reduce direct water demand while having different electricity requirements, especially in hot conditions.
Liquid at the server rack does not, by itself, tell you how heat ultimately leaves the facility. A liquid-cooled computing loop may still transfer heat to equipment that uses evaporative cooling. Ask about the entire chain from chip to outdoor environment.
DOE's design guide distinguishes site-based WUE from source-based water accounting, which includes water associated with producing electricity used by the facility. That distinction prevents “low water use” from becoming an unqualified claim about the whole system. DOE design guide, water metrics.
Worked example: compare equal IT energy first
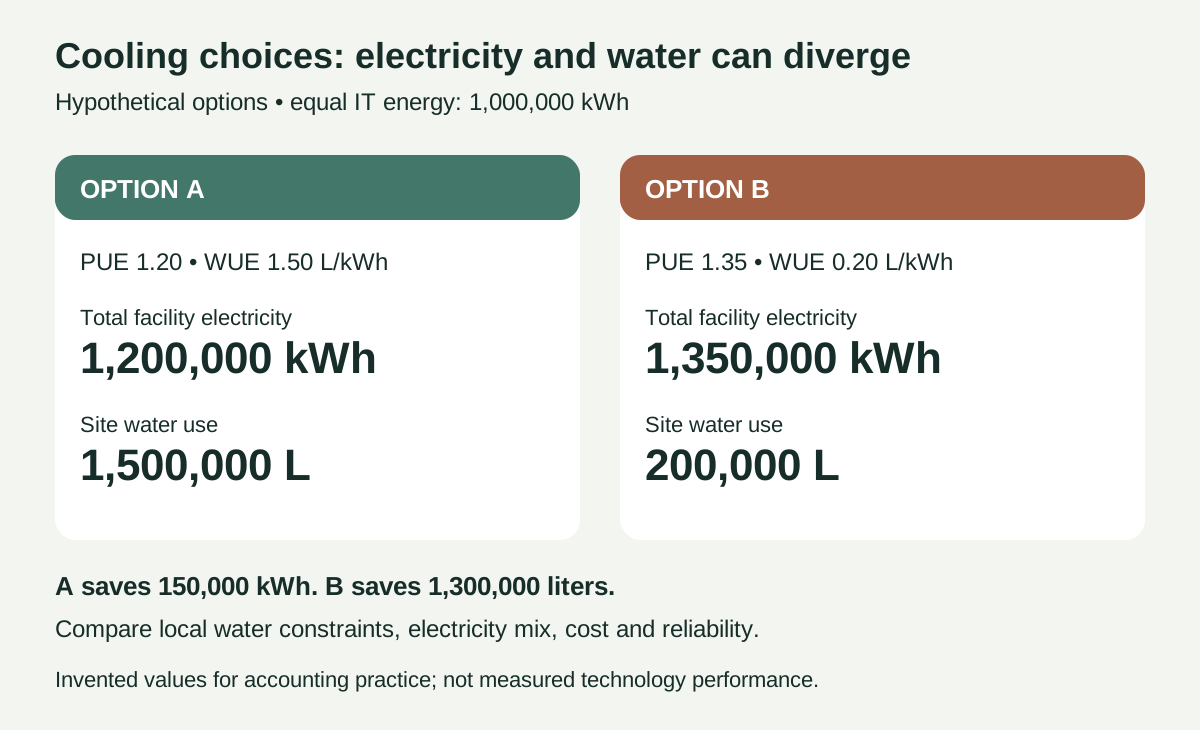
Assume two hypothetical cooling options support the same 1,000,000 kWh of IT energy over a reporting period. All values below are invented for arithmetic; they are not performance promises for specific technologies.
| Item | Option A | Option B |
|---|---|---|
| IT energy | 1,000,000 kWh | 1,000,000 kWh |
| PUE | 1.20 | 1.35 |
| Total facility energy | 1,200,000 kWh | 1,350,000 kWh |
| Non-IT energy | 200,000 kWh | 350,000 kWh |
| Site WUE | 1.50 L/kWh | 0.20 L/kWh |
| Site water use | 1,500,000 L | 200,000 L |
Option A uses 150,000 kWh less facility energy. Option B uses 1,300,000 liters less site water. Neither result chooses a winner without the decision context.
At an assumed electricity price of $0.10/kWh, B's additional energy costs $15,000. At an assumed combined water and wastewater charge of $2 per cubic meter, B's 1,300 cubic meters of water savings are worth $2,600. The simplified utility-cost difference favors A by $12,400, before capital, maintenance, demand charges, reliability, or scarcity constraints.
This does not put a universal price on water. It shows why a facility's private bill can favor a different option from a local water-resilience assessment. The tariff may not reflect every consequence of demand during a drought.
Add electricity-related water without double counting
For a second illustrative assumption, suppose electricity generation consumes 0.5 liters per kWh supplied. Applying the same simplified factor to both options gives A 600,000 liters of electricity-related water consumption and B 675,000 liters.
If the site figures above are also explicitly defined as consumption, an expanded total becomes 2.10 million liters for A and 0.875 million liters for B. B still uses less water under these assumptions, despite its greater electricity demand.
The accounting lesson is more useful than the particular numbers. Label whether a reported figure is withdrawal or consumption. Water withdrawn and later returned is not interchangeable with water consumed through evaporation. Also verify whether an electricity factor already includes effects counted elsewhere in your assessment.
A September 2026 preprint models how data-center cooling choices can move water impacts through the electricity system. It provides a timely research perspective, but modeled results are not measured outcomes at every facility, and preprint status is not peer-reviewed confirmation. Integrated water-energy modeling preprint.
Annual ratios cannot settle a local permitting question
One annual liter total hides the timing and location of demand. A cooling system may draw most heavily when a local water system is under pressure. Two facilities with the same annual WUE can therefore pose different operational questions.
For an internal investment review, request monthly water use, peak-day requirements, source type, discharge arrangements, and drought operating plans. Ask which figures are metered, estimated, or supplied by a vendor. Keep uncertainties visible in the financial model.
Also resist comparing sites solely by a lower ratio. If a facility doubles IT energy while improving WUE from 1.0 to 0.8 L/kWh, absolute site water rises by 60 percent: 2 × 0.8 = 1.6. That is an accounting identity under the stated assumptions, not a forecast. Efficiency improvement and resource growth can happen together.
Operations matter after the equipment purchase
A cooling tower loses water through evaporation, drift, blowdown, and other system losses. Blowdown helps control dissolved solids. DOE recommends monitoring and qualified water-treatment input when optimizing cycles of concentration; the safe operating point depends on water quality and treatment, not a universal target. DOE cooling tower management.
A procurement model should therefore include who operates the system, what sensors must be maintained, and how control changes are verified. An elegant design can underperform if metering drifts, operating assumptions change, or a maintenance team lacks clear procedures.
For a practical review, collect one sheet containing the service requirement, energy boundary, water boundary, reporting period, climate assumptions, tariff assumptions, and reliability constraints. Compare options only after those fields match. Then run sensitivity cases for hotter weather, higher tariffs, and constrained water availability.
Frequently asked questions
Does lower PUE always mean lower electricity use? No. Multiply PUE by IT energy. A growing IT load can outweigh the ratio improvement.
Does closed-loop liquid cooling mean no water consumption? Not necessarily. The loop description does not identify the final heat-rejection method or all makeup-water requirements.
Can a single WUE value establish sustainability? No. It needs an explicit boundary, period, absolute water total, and local context. It also says nothing by itself about useful computing output or carbon emissions.
Sources and review scope
Checked October 21, 2026: IEA's data-center tracking page (latest findings identified as June 2026); DOE cooling-water efficiency guidance; DOE's July 2024 design guide; DOE cooling tower management guidance; and the September 2026 water-energy modeling preprint. Each linked source supports the adjacent factual discussion. The comparison and dollar figures are original illustrative calculations; a real engineering decision requires site-specific design and operating data.