Flexible Data Centres: Can AI Workloads Help the Grid at Its Busiest Hour?
Understand data centre demand response, trace a synthetic load-shifting example, and assess deadlines, rebound demand, contracts, and electricity claims.
Reviewed October 12, 2026. News dates are stated separately below. All worked load values are synthetic; the Python example uses only the standard library.
Imagine a data centre with a training job that must finish tomorrow morning and a chat service that must answer immediately. At 6 p.m., the local electricity system is under pressure. Pausing both workloads would make the building flexible, but it would also break the service people are using. The useful question is whether the training job can move while the chat service keeps its promise.
That distinction is becoming part of the AI infrastructure debate. An October 8 Reuters report examined whether flexible data-centre demand could ease grid investment pressures. The practical idea is demand response: adjust electricity consumption when the system needs relief, under an agreed operational and commercial arrangement.
For readers following AI, engineering, or business investment, this is a useful change of perspective. A facility's annual electricity use is only part of its relationship with the grid. Its location, busiest hours, recovery schedule, and ability to honour a reduction request can matter just as much. Here is how to evaluate that relationship without turning a promising capability into a claim that AI runs on free energy.
A flexibility announcement needs a precise reading
In a March 19, 2026 announcement, Google said it had integrated one gigawatt of demand-response capacity into long-term agreements with utility partners. It described limiting or moving a portion of machine-learning workloads, with availability restricted to certain locations. This is the company's account of contracted capability, rather than an independent measurement of one gigawatt delivered during every grid event.
When reading a similar announcement, separate four questions. How much capacity is contracted? How much is actually available at a particular hour? How much is requested by the operator? How much reduction does the meter verify? A contract can be valuable before it has a long performance history, but those measures should not be presented as interchangeable evidence.
Also ask what the reduction is measured against. A facility already operating below its expected load might appear to deliver a reduction under one baseline but little under another. A defensible report explains the baseline method, event window, and treatment of changes unrelated to the request. That is a measurement issue with consequences for both payments and planning.
Separate power, energy, and the hour that matters
Power describes the rate of electricity use, measured here in megawatts. Energy describes consumption over time, measured in megawatt-hours. Reducing four megawatts for two hours removes eight megawatt-hours from that event window. It does not prove that those eight megawatt-hours disappear from the day's consumption.
The relevant peak also needs a name. A site's highest demand, a local feeder's highest demand, and a whole electricity system's highest demand may occur at different times. Moving work into a period that is quieter for the wider system can increase the site's own maximum. Whether that move is feasible depends on its connection, equipment, and contract.
The IEA's Electricity 2026 flexibility chapter describes demand response as shifting or shedding demand in response to system or market signals. It distinguishes utilised flexibility from technical and theoretical potential. That vocabulary is helpful: equipment that can adjust its load has not necessarily enrolled in a programme, passed a performance test, or become dependable capacity for a network planner.
Trace one scheduling decision all the way through recovery
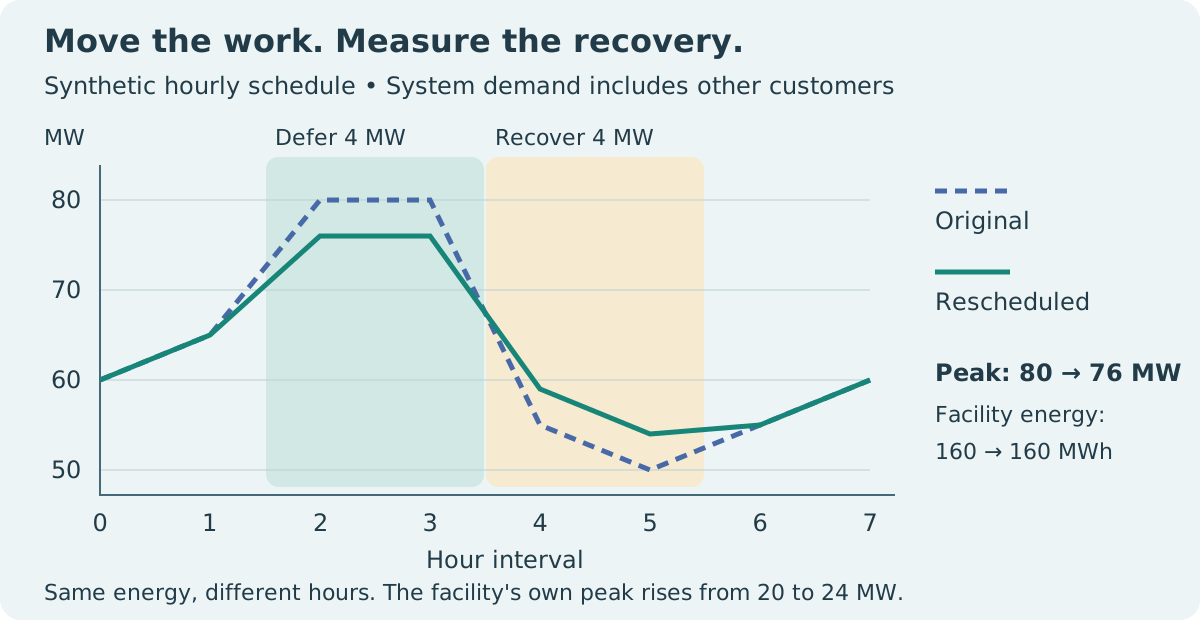
Suppose an illustrative facility normally draws twenty megawatts over eight one-hour intervals. Other customers create the system's busiest hours at intervals two and three. The facility defers four megawatts in each of those hours and restores the same amount at intervals four and five. We assume equipment and the connection can support the later twenty-four-megawatt load.
| One-hour interval | Other demand, MW | Original facility, MW | Rescheduled facility, MW | Rescheduled system, MW |
|---|---|---|---|---|
| 0 | 40 | 20 | 20 | 60 |
| 1 | 45 | 20 | 20 | 65 |
| 2 | 60 | 20 | 16 | 76 |
| 3 | 60 | 20 | 16 | 76 |
| 4 | 35 | 20 | 24 | 59 |
| 5 | 30 | 20 | 24 | 54 |
| 6 | 35 | 20 | 20 | 55 |
| 7 | 40 | 20 | 20 | 60 |
other_mw = [40, 45, 60, 60, 35, 30, 35, 40]
original_mw = [20] * 8
scheduled_mw = [20, 20, 16, 16, 24, 24, 20, 20]
duration_hours = 1
original_system = [a + b for a, b in zip(other_mw, original_mw)]
scheduled_system = [a + b for a, b in zip(other_mw, scheduled_mw)]
assert max(original_system) == 80
assert max(scheduled_system) == 76
assert sum(original_mw) * duration_hours == 160
assert sum(scheduled_mw) * duration_hours == 160
assert max(scheduled_mw) == 24
deferred_mwh = sum(original_mw[h] - scheduled_mw[h] for h in [2, 3])
recovered_mwh = sum(scheduled_mw[h] - original_mw[h] for h in [4, 5])
assert deferred_mwh == recovered_mwh == 8
print("System peak:", max(original_system), "->", max(scheduled_system))
print("Facility energy, MWh:", sum(scheduled_mw) * duration_hours)
The system peak decreases from eighty to seventy-six megawatts, while the facility consumes the same one hundred and sixty megawatt-hours. Its own peak rises to twenty-four. These are arithmetic consequences of our chosen schedule, rather than measured savings at an operating data centre. The calculation also assumes moving work does not alter its energy requirement or cooling behaviour.
This example reveals why a reduction percentage without a time boundary is incomplete. A report about peak relief can be entirely valid even when annual consumption remains unchanged. Conversely, a facility can reduce annual consumption while offering very little dependable help during the particular hours when a network is constrained.
Classify the workload before promising to move it
A scheduling team should start with service requirements. Which jobs have deadlines? Which can pause and resume? Which have intermediate state that must be saved? Which depend on data being processed in a particular jurisdiction? The answer should come from the workload owner rather than from an assumption that every GPU task is equally deferrable.
A customer-facing service may tolerate some routing changes but still need strict response times. A batch analysis may tolerate hours of delay but require an uninterrupted run once started. A training job may have a checkpoint mechanism whose storage and recovery costs change the economics of interruption. Each case needs a tested policy.
An original planning worksheet can record the deadline, maximum delay, restart overhead, permitted location, and responsible owner for each workload class. Add the failure case: what happens if a grid event lasts longer than expected? A schedule with no contingency can exchange an electricity problem for an unfinished customer commitment.
Batteries and geographic routing have different boundaries
A battery can reduce grid imports while the computers continue running. Workload deferral instead changes when the computers perform work. Both can provide relief, but their constraints differ. Storage has power and energy limits, charging losses, and a reserve requirement. A two-hour request cannot be evaluated using battery power alone.
Consider a deliberately simplified battery delivering eight megawatt-hours with ninety per cent round-trip efficiency. Restoring that delivered energy requires about 8.89 megawatt-hours of charging electricity. A backup reserve further reduces what is available for grid participation. This arithmetic is illustrative; actual battery dispatch also needs equipment-specific efficiency, temperature, ageing, and operating limits.
Moving computation geographically shifts the place where electricity is used. It may help one constrained network while increasing another location's demand. It can also involve data-transfer energy, latency, privacy requirements, and additional copies of data. Evaluate the whole operation before describing a move as an emissions reduction.
The EPFL team's July 2026 account of its energy-system research examined deferrable workloads and heat recovery within a model of Europe's future energy system. Modelled possibilities are useful for planning; they require local operational evidence before becoming a promise about a specific facility.
Build a contract around delivery and recovery
A flexibility offer should specify magnitude, duration, notice, event frequency, and recovery. Four megawatts for fifteen minutes is different from four megawatts for four hours. An offer available after one day's notice cannot automatically support a request that arrives in seconds. A second event before recovery may leave much less capability available.
The same offer needs a measurement plan and a responsible party. Identify the meter, baseline, settlement interval, permitted exclusions, and consequence of failing to deliver. If customers own the workloads, clarify who has authority to reschedule them and what incentive makes participation acceptable.
Recovery deserves its own constraint. Several facilities restoring deferred jobs simultaneously could create another demand spike. In our example there is room in the later system profile; another day might provide less room. Coordinate the recovery window rather than treating it as an invisible afterthought.
Judge system benefits with the right evidence
The IEA's June 2026 demand-flexibility report treats flexibility as a capability requiring technology, market arrangements, and participation. Its cases span different places and time horizons. That is a reason to examine local assumptions carefully instead of transferring a headline saving from one system to another.
A planner can ask for an availability history, demonstrated response times, completed workload deadlines, and the resulting recovery profile. An investor can ask which payments are contracted, which are contingent, and which costs remain with the facility. A community can ask who funds connection upgrades and how performance is enforced. These are different questions, and a single attractive percentage will not answer all of them.
Emissions claims need a separate assessment of which generation changes when demand moves. A lower bill does not establish lower emissions. A lower grid peak does not establish lower annual energy. Keeping those outcomes separate makes the value of flexibility easier to understand and much harder to exaggerate.
Questions readers often ask
Does demand response mean shutting down the entire data centre? Usually the useful design is selective: identify an agreed adjustable portion while protecting required services. Whether that portion exists, and how large it is, must be demonstrated for the facility and event being discussed.
Can a flexible connection replace all new grid investment? Flexibility can change some capacity needs, but persistent load growth, local constraints, reliability requirements, and recovery demand still need planning. A conditional arrangement should state when limits apply and what happens if the facility cannot comply.
For the next announcement you read, keep five facts together: where the capability exists, how much can move, for how long, what service still finishes, and when the electricity comes back. Those details turn an AI energy headline into a decision a reader can actually assess.
Sources and reporting scope
- Reuters, October 8, 2026: current reporting on data-centre flexibility. Used only for the dated news context.
- Google, March 19, 2026: contracted demand-response announcement. An interested company's description of its own programme.
- IEA, 2026: electricity-system flexibility and Scaling Up Demand Flexibility. System-level frameworks, not a validation of our fictional facility.
- EPFL, July 13, 2026: research communication on flexible workloads and energy-system modelling.
The schedule, table, battery arithmetic, diagram, and evaluation worksheet are original instructional examples. They illustrate what to measure without estimating any real facility's capacity, costs, or emissions.