AI and Data-Centre Electricity: How to Read the Numbers Without Losing the Grid
Interpret global forecasts, local grid pressure, efficiency gains, and uncertainty in claims about AI's electricity use.
Reviewed October 10, 2026. Forecast figures come from the IEA's 2025 Energy and AI report and should be read as scenarios, not guaranteed outcomes.
AI feels like software, but every model request is executed by physical equipment. Accelerators, memory, networking, cooling systems, and power conversion all consume electricity. The relevant question is not simply “How much energy does AI use?” It is which workload, hardware, data centre, location, time, and system boundary a number describes.
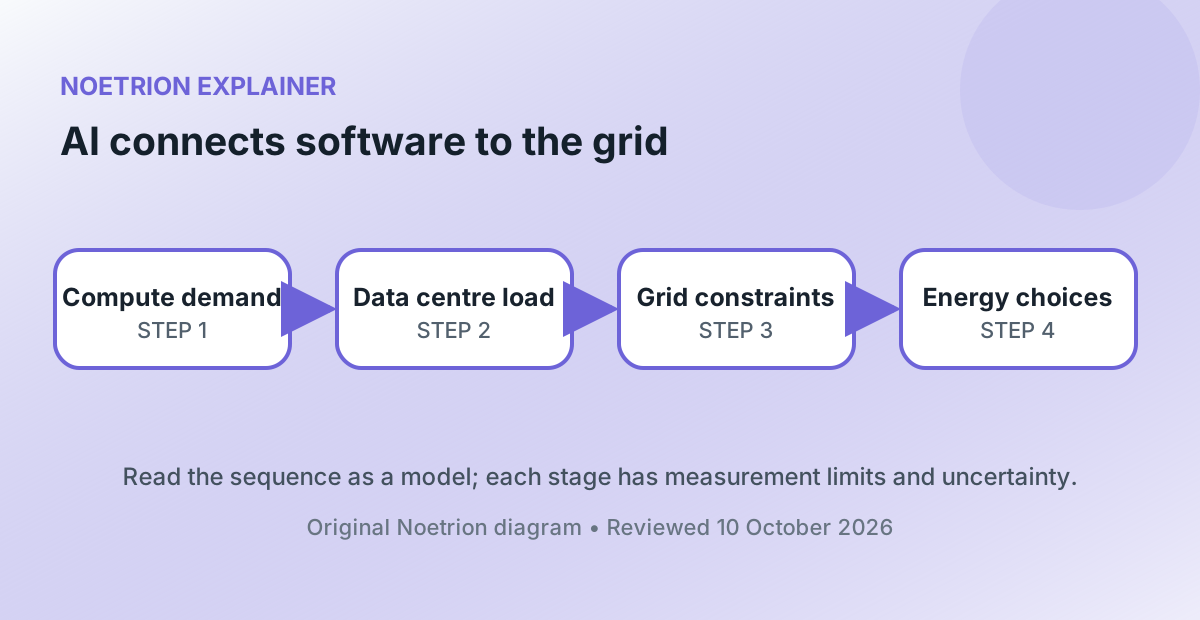
The International Energy Agency estimated that data centres used about 415 terawatt-hours in 2024, around 1.5% of global electricity consumption. Its base case projects roughly 945 TWh in 2030, with AI as the largest driver of the increase. Those global totals are useful, but local concentration can matter more to a grid operator than the worldwide percentage.
1. Separate AI from the whole data-centre category
Data centres run cloud storage, streaming, enterprise software, search, scientific computing, and many other services. A headline about all data-centre electricity is not automatically an AI-only estimate. Conversely, a measurement of one model-training run excludes ongoing inference, data preparation, failed experiments, networking, and the facility overhead needed to operate the machines.
A credible estimate declares its boundary. Chip power, server power, facility power, and electricity delivered by the grid are different quantities. Operational electricity also differs from life-cycle impacts that include manufacturing equipment and constructing facilities.
2. Power and energy answer different questions
Power, measured in watts, describes the rate of using energy at a moment. Energy, measured in watt-hours, accumulates that rate over time. A facility with a large peak demand can stress local capacity even if its annual energy total seems moderate. A flexible workload that can shift in time may have the same annual consumption but a different effect on grid peaks.
| Quantity | Useful question | Common mistake |
|---|---|---|
| Megawatts of load | What capacity must be available now? | Treating it as annual consumption |
| Megawatt-hours | How much electricity was used over a period? | Ignoring when it was consumed |
| PUE | How facility energy relates to IT energy | Treating it as model efficiency |
| Carbon emissions | What generation and timing supplied the load? | Multiplying by an unrelated average factor |
Power usage effectiveness, or PUE, divides total facility energy by energy used by IT equipment. It helps describe overhead such as cooling and conversion, but it says nothing about whether a model accomplishes more useful work per unit of IT energy.
3. Global share can conceal a local bottleneck
The IEA reports that nearly half of United States data-centre capacity is concentrated in five regional clusters. A new facility may request a connection comparable to a power-intensive factory while being built near other facilities with similar needs. Transmission, transformers, generation, and interconnection processes then become the limiting system.
This is why “only a small percentage globally” can be true at the same time as a serious local constraint. Electricity cannot always be moved instantly from an unconstrained region to a congested cluster. The IEA estimates that about 20% of planned projects could face delay if grid risks are not addressed.
4. Forecasts are conditional stories
Demand depends on adoption, model size, request volume, hardware efficiency, software efficiency, utilization, pricing, and construction speed. The IEA's 2035 scenarios span roughly 700 to 1,700 TWh for data centres. The width is not a flaw to hide; it is information about unresolved drivers.
Efficiency can reduce energy per computation while lower prices stimulate more computation. This rebound means an efficient chip does not guarantee a fall in total consumption. The correct accounting identity is approximately: number of tasks multiplied by computation per task multiplied by energy per unit of computation, plus facility overhead. Each factor can move differently.
5. Training and inference have different profiles
Training a frontier model is a large, bounded project with an observable start and end. Inference serves user requests continuously and can accumulate across millions of interactions. Small models, caching, batching, quantization, and specialized hardware can reduce inference cost, but user growth or more elaborate reasoning can offset those gains.
Avoid universal “energy per prompt” numbers. The answer changes with model, token count, batch size, hardware, utilization, data-centre overhead, and whether idle capacity is allocated to the request. Providers rarely expose every variable needed for an independent calculation.
6. Electricity source and timing shape emissions
Two identical facilities can have different emissions if their grids use different generation mixes. An annual renewable-energy contract is not the same as matching consumption with carbon-free supply every hour at the same location. Both can be meaningful procurement strategies, but they answer different accounting questions.
The IEA base case projects data-centre electricity-related emissions rising from about 180 million tonnes today to 300 million tonnes in 2035, while remaining below 1.5% of total energy-sector emissions. This simultaneously describes rapid growth and a limited global share. Selectively reporting only one half creates a distorted picture.
7. AI may also change energy use outside data centres
AI can support forecasting, equipment maintenance, building controls, industrial optimization, and scientific discovery. Potential savings should not be subtracted automatically from data-centre consumption. They require deployment, measured baselines, and evidence that behavior did not simply shift demand elsewhere.
Likewise, a claimed optimization is not a system-wide climate result. A faster route can reduce fuel per trip while encouraging more trips. Benefits should be evaluated at the level of the final activity and across a realistic period.
8. A disciplined reading checklist
Ask whether a number concerns AI, all data centres, or an entire digital sector. Check whether it measures power, energy, water, or emissions. Record geography, year, scenario, and system boundary. Look for uncertainty ranges rather than a single forecast. Finally, compare global totals with local grid capacity and hourly conditions.
The physical footprint of AI is neither negligible nor a simple apocalypse counter. It is an infrastructure problem with measurable components and policy choices: efficient computation, transparent reporting, better siting, grid investment, flexible operations, and cleaner electricity. Keeping those components separate produces decisions that a dramatic per-query estimate cannot.
Turn the global forecast into an operator checklist
Before purchasing capacity, describe the actual workload: latency-sensitive inference, scheduled batch work, and peak demand need different operating plans. Test whether caching, smaller models, fewer repeated requests, or batching meet the same quality threshold. Record output quality alongside energy and cost; a reduction that breaks the task is not an efficiency gain.
| Check | Evidence to collect | Decision boundary |
|---|---|---|
| Workload | Useful completed tasks, peak load, latency target | Compare equivalent service quality |
| Facility | Power availability, cooling, backup, contracts | Annual electricity is not peak connection capacity |
| Software | Cache hits, retry volume, model routing | Provider utilization can change realized savings |
Continue with the local capacity scenario worksheet for power arithmetic, or the PUE and WUE guide for facility boundaries. These answer narrower questions than the global demand projection.