Drawing to Learn: Make a Diagram That Can Be Wrong
Use a simple causal drawing to expose gaps in understanding, test a prediction, and check feedback without confusing attractive notes with learning.
A page of beautiful arrows can hide the same misunderstanding as a page of copied sentences. If every arrow means only “is related to,” the diagram may look complete while explaining very little. A useful study drawing makes a claim: something moves, changes, constrains something else, or causes a result under stated conditions. That claim can then be checked.
Drawing-based learning is receiving renewed attention as AI tools offer prompts and feedback. But the useful question is more specific than whether drawing is good: What should the learner construct, and what evidence would reveal that the construction is wrong? This guide proposes a practical exercise for technical subjects. The exercise is an editorial application, not a separately validated learning intervention.
What the recent AI research actually demonstrates
The February 2, 2026 Draw2Learn preprint describes a human–AI system that supplies drawing tasks, optional scaffolding, progress monitoring, and feedback. Its reported evaluation is formative user feedback, including usability and usefulness ratings. That supports discussion of an interface design; it does not establish that using the system raises exam scores or produces durable understanding compared with other methods.
This distinction matters when choosing study software. A tool can make an activity easier to begin without making its explanations correct. Evaluate whether it helps you find a specific misconception, whether you can verify its correction, and whether you can later solve a new problem without the tool.
Drawing is not a universal upgrade to studying
A 2024 experiment by Lawson and Mayer tested generative activities during animated lessons about greenhouse gases. Written summaries outperformed the no-activity comparison on the reported posttests, while drawing did not show a significant advantage over that comparison. Adding drawing to summarizing also did not significantly outperform summarizing alone. The study examined particular multimedia lessons and activities, not every possible diagram-based exercise.
A 2021 study by Fiorella, Pyres, and Hebert gives another caution. Provided drawings or explanations improved the quality of the complementary activity, but that advantage did not translate into better delayed posttest performance. A stronger-looking learning product is therefore insufficient evidence of stronger learning.
Use those results as a reason to test your method rather than to abandon drawing. If a drawing never helps you answer a question, choose a different activity. The recommendations below focus on making the product inspectable, then evaluating understanding independently.
Choose a mechanism, not a chapter title
Start with a narrow question that requires a relationship. “Water systems” is too broad. “Will the volume in this tank rise or fall?” is workable. “Database normalization” is too broad. “Why does storing a department phone number in every employee row create an update problem?” gives the drawing a job.
Write a one-sentence prediction before drawing. Then identify the smallest set of entities needed to explain it. For the tank, use the container, inlet, outlet, and volume. A decorative building, realistic water texture, or elaborate pump illustration would add no information to this exercise.
Keep a separate box for assumptions. Constant flow is an assumption; an observed flow measurement is evidence. An uncluttered diagram should preserve that distinction. If assumptions change, the answer may change even though the arrows remain visually identical.
Build an original worked example with units
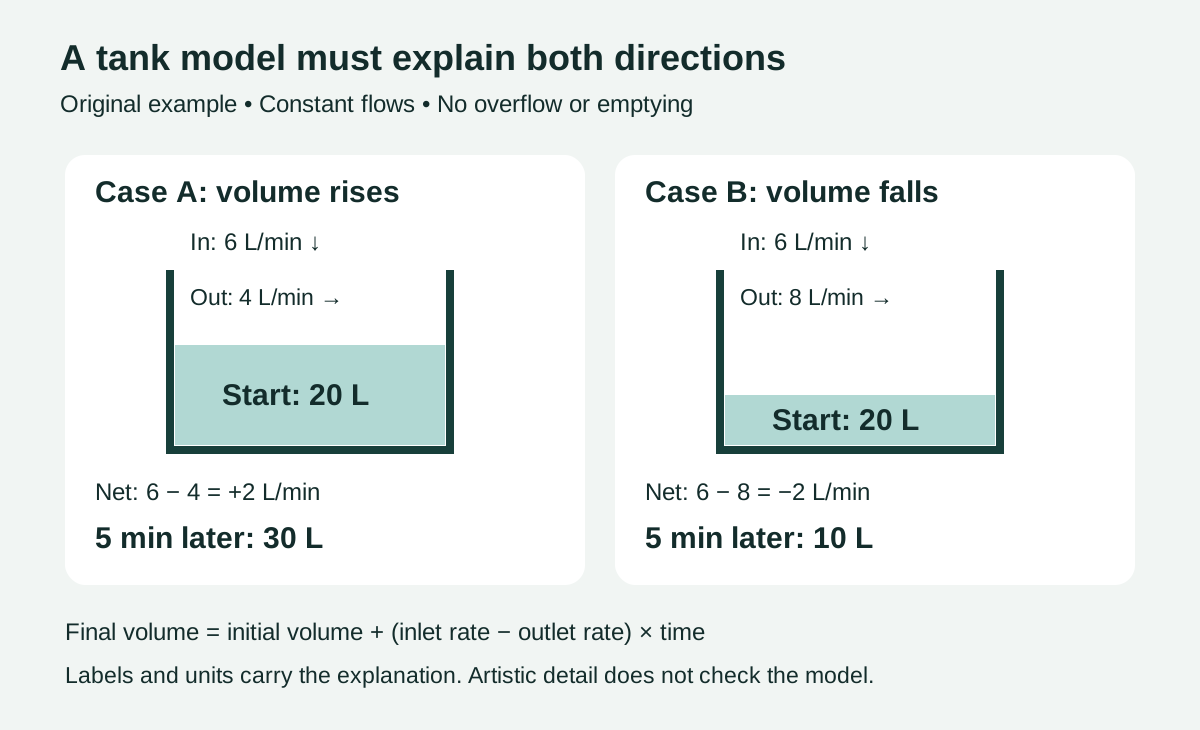
Consider a fictional tank containing 20 liters. Water enters at 6 liters per minute and leaves at 4 liters per minute. Assume those rates remain constant for five minutes, there is enough capacity to avoid overflow, and the tank never empties.
The net rate is 6 − 4 = 2 liters per minute. The five-minute change is 2 × 5 = 10 liters, so the final volume is 30 liters. Draw the two flows in different directions and write their units directly on the arrows. Put “volume, liters” inside the tank rather than labeling it merely “water.”
Now change only the outlet to 8 liters per minute. The net rate becomes −2 liters per minute, leaving 10 liters after five minutes. The drawing must allow both cases. If the diagram implies that adding an inlet always makes the level rise, it cannot explain the second case and needs revision.
| Drawing feature | What it should communicate | Check it with a question |
|---|---|---|
| Arrow direction | Which way water crosses the boundary | Is the outlet pointing out? |
| Arrow label | A rate, including units | Is 6 measured in liters or liters per minute? |
| Tank label | The stored quantity | Are we tracking volume or flow? |
| Assumption box | Constant rates and usable capacity | Would overflow invalidate the calculation? |
| Prediction | Direction and size of change | Can the model explain a falling level? |
The arithmetic is deliberately simple. The learning task is distinguishing a stock from a rate and testing whether the representation supports that distinction.
Run a short draw, explain, challenge cycle
Try this suggested 15-minute session. Spend two minutes selecting a mechanism and predicting an outcome. Spend four minutes drawing from your understanding, with the source closed. Spend three minutes explaining every arrow aloud. Spend four minutes checking against a trusted explanation and revising errors. Use the remaining two minutes to answer a changed-case question without looking back.
Do not treat that timing as a research-derived optimum. Shorten or extend it according to the task. The essential constraint is to leave time for checking and a separate attempt. Spending the whole session polishing the picture removes the opportunity to discover what it fails to explain.
During checking, mark errors in place: “wrong unit,” “missing boundary,” or “direction depends on assumption.” A specific correction makes the next attempt easier to assess. Erasing every trace of the original reasoning can leave you with a correct diagram and no record of why you needed to change it.
Ask AI for critique you can verify
A focused prompt is more useful than “Is my diagram good?” For example: “List each physical quantity, its unit, and the relationship claimed by each arrow. Identify any claim that cannot be checked from the information shown. Do not redraw the diagram or supply a final solution yet.”
Then inspect the feedback. A model might confidently invent an assumption, misread handwriting, or praise a picture that omits a key dependency. Ask it to identify the exact label or relationship behind each criticism, and compare that criticism with the textbook, instructor solution, or calculation.
For the tank example, manually recomputing the two cases is enough. For a medical or engineering mechanism, use the relevant authoritative teaching material. An AI-generated explanation should remain a proposed explanation until it passes a check appropriate to the subject.
Judge learning with a different task
Close the corrected drawing. Explain the mechanism in words, solve a changed numerical case, or identify a deliberately incorrect arrow in another drawing. If you can reproduce only the layout, try changing the layout while preserving the relationships.
For the tank, ask what happens if inlet and outlet rates are equal. Then ask what additional information you would need if the outlet rate varied with water height. The first tests the same model; the second tests recognition of its boundary. Neither requires a polished drawing.
Keep the method only if those independent attempts become more accurate or easier to explain. This is a practical personal check, not a controlled experiment: prior practice, easier questions, and feedback can all affect improvement.
Frequently asked questions
Do I need artistic ability?
For this exercise, boxes, arrows, and readable labels are enough. Add visual detail only when it carries a relationship that the simpler drawing cannot show.
Should I draw while watching a lecture?
Use brief pauses if they help you form and check a specific explanation. Avoid trying to illustrate everything. The multimedia evidence above is a reminder that another activity, including a concise written explanation, may fit better.
Is a correct diagram enough before an exam?
No. Treat it as one representation of your reasoning. Follow it with an independent question in the format you will need to perform.
Sources and evidence scope
- Hang, Draw2Learn, submitted February 2, 2026: prototype design and formative feedback, not comparative proof of learning gains.
- Lawson and Mayer, Generative learning activities for online multimedia learning, September 2, 2024: experimental boundary conditions for drawing and summarizing.
- Fiorella, Pyres, and Hebert, Explaining and drawing activities for learning from multimedia, first published September 6, 2021: activity quality and delayed learning were different outcomes.
Sources checked October 21, 2026. The tank problem, timetable, prompts, and study workflow are original illustrative applications; no learning-effect percentage is claimed.