How to Read Economic Forecasts Without Turning Them into Business Promises
Read economic forecasts with the right dates, units and assumptions, then build a practical business scenario table without inventing certainty or future data.
Reviewed October 12, 2026. The IMF's full October 2026 World Economic Outlook is scheduled for October 13; this article does not report its unreleased forecast figures.
A business owner reads that the economy is expected to grow, then orders more inventory. The headline may be accurate. The decision may still be poorly supported. An economy can expand while a particular product loses customers, imported materials become more expensive, or cash arrives too late to cover a supplier invoice.
Economic forecasts are useful context, but they need translation before they belong in a business plan. That translation starts with dates, definitions, and assumptions. It ends with decisions that can be revised when evidence changes.
The timing is especially relevant this week. The 2026 IMF–World Bank Annual Meetings run from October 12 to October 18 in Bangkok. The IMF's October 2026 World Economic Outlook page lists the full report for October 13, following analytical chapters earlier in the month. As of this article's review date, those upcoming headline projections should not be represented as published data. A coming-soon page is a publication schedule, not a source for numbers that have not been released.
Read the date before the percentage
Every forecast has at least two dates: when it was made and the period it describes. “Growth next year” means little without knowing when the statement was published. A figure for 2027 from a January release and one for 2027 from a later release are different forecast vintages, even though they target the same year.
For your own notes, record the institution, publication date, target period, indicator, geography, unit, and whether the figure is an observation, estimate, or projection. Keep a copy of the source or an exact link to the dated release. That small habit prevents an old headline from quietly becoming a current assumption.
The IMF's WEO FAQ explains that the main database is updated around the twice-yearly reports, while interim updates cover selected projections. It also notes that historical data can be revised and that country-team methods vary. Consequently, a newer file can change both the outlook and the history used to assess it.
Do not overwrite your previous planning input without a note. Preserve the earlier value and write down why you replaced it. If a plan later fails, you will want to know what was reasonable with the information available at the time, rather than judge it against facts learned afterward.
Check what the measure actually measures
Real GDP growth concerns inflation-adjusted economic output. It does not directly tell a shop owner how much sales revenue will rise. Revenue also depends on prices, customer mix, competition, distribution, and the particular market being served.
A percentage change is also different from a percentage-point change. Moving from a hypothetical growth rate of 3% to 2% is a decline of one percentage point. Calling it “down 1%” creates ambiguity. For example, reducing 3% by 1% of its value gives 2.97%, a very different result.
Annual measures and monthly experience can diverge. A supplier may raise prices abruptly even when an annual inflation number looks moderate. Similarly, country averages can hide differences between cities, industries, and households. The narrower the decision, the more you need evidence close to the actual customers and costs involved.
For a student building an analysis portfolio, include a data dictionary alongside the chart. Name the series, frequency, units, seasonal treatment if relevant, and geographic coverage. An attractive line chart with unclear definitions makes an interpretation easier to misunderstand, not easier to trust.
A forecast, a scenario, and a target are different things
A forecast is an evidence-based expectation produced under specified information and assumptions. A scenario asks what would happen under a chosen set of conditions. A target states what an organisation wants to achieve. Confusing these makes plans look more rigorous than they are.
The following distinctions form a practical reading guide:
| Statement | What it means | What it does not establish |
|---|---|---|
| An institution forecasts growth | Its projection for the specified measure and period | Your business's sales growth |
| A plan uses a downside scenario | A conditional stress case chosen for analysis | A statistically calibrated probability |
| A team targets higher revenue | An intended outcome | An independent forecast |
| An updated release revises history | Earlier measurements or estimates changed | That every previous decision was irrational |
| An average rate remains positive | An aggregate increases over the defined period | That every sector improves |
This distinction also protects honest communication. Label a management assumption as an assumption, even if it was inspired by a respected institution's report. Readers should be able to see where external evidence ends and the planner's judgment begins.
Translate the headline into your actual exposure
Start by identifying the pathways through which an economic change could affect you. A subscription business may be sensitive to customer cancellations. A manufacturer may face changing energy costs, supplier terms, and financing costs. An importer may experience an exchange-rate movement before customer demand changes at all.
Pick a small number of exposures that you can observe. For each, specify a metric and a review date. “Weak demand” becomes more useful when translated into order counts, repeat purchases, or signed contracts. “Cost pressure” becomes more useful when linked to quoted input prices and payment terms.
The diagram shows an original planning framework, not an IMF forecasting model:
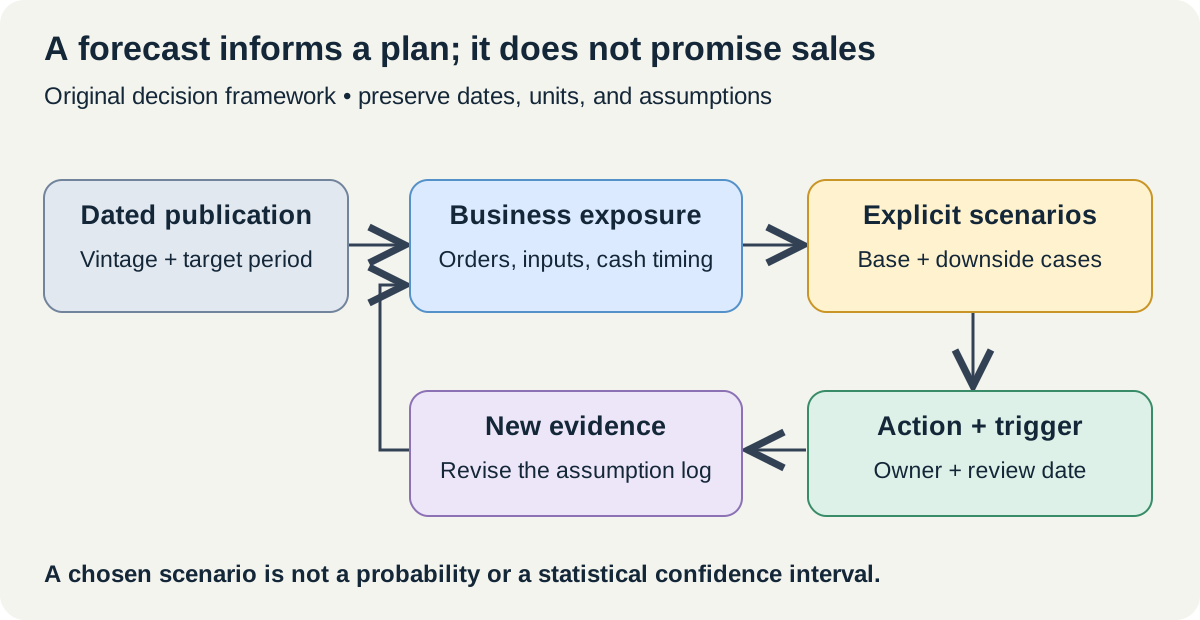
Use the macroeconomic report to challenge your plan rather than dictate it. If your sales projection assumes rapid expansion, ask what local evidence supports that assumption and how the plan behaves if it is wrong. The exercise is valuable even when no one can assign a trustworthy probability to the downside.
Build a small scenario model you can reconcile
Consider a hypothetical business that sells one product for $100. Its variable cost is initially $60 per unit and monthly fixed operating cost is $3,000. These are invented teaching inputs, not market data, forecast figures, or a recommendation to start a business.
Revenue equals units sold multiplied by price. Contribution equals revenue minus variable cost. Operating result in this simplified model equals contribution minus fixed cost. It omits taxes, interest, depreciation, inventory timing, refunds, and many other real-world expenses.
| Synthetic monthly scenario | Units | Price | Variable cost per unit | Revenue | Contribution | Operating result |
|---|---|---|---|---|---|---|
| Downside | 80 | $100 | $66 | $8,000 | $2,720 | −$280 |
| Base planning case | 100 | $100 | $60 | $10,000 | $4,000 | $1,000 |
| Upside | 120 | $100 | $60 | $12,000 | $4,800 | $1,800 |
The downside combines lower demand with a higher input cost. It is a stress scenario chosen to expose vulnerability, not a forecast that those conditions will occur together. The table shows how a profitable base case can leave little room for an unfavourable combination.
This complete Python program verifies the arithmetic using the standard library:
from decimal import Decimal as D

fixed = D("3000")
scenarios = {
    "downside": (80, D("100"), D("66")),
    "base": (100, D("100"), D("60")),
    "upside": (120, D("100"), D("60")),
}
results = {}
for name, (units, price, variable) in scenarios.items():
    revenue = units * price
    contribution = units * (price - variable)
    result = contribution - fixed
    results[name] = result
    print(name, revenue, contribution, result)

assert results == {
    "downside": D("-280"),
    "base": D("1000"),
    "upside": D("1800"),
}
break_even_units = fixed / (D("100") - D("60"))
assert break_even_units == D("75")
Under the base assumptions, 75 units cover the modelled fixed cost. At a $66 variable cost, each unit contributes $34 instead of $40, so the threshold changes. Always recalculate the threshold when an input changes; a memorised break-even point belongs to a particular set of assumptions.
Cash timing can overturn a profitable-looking plan
The scenario table describes operating results, not cash in the bank. A business can record revenue while waiting for payment. It can also pay for inventory before selling it. Those timing differences can make a positive operating result coexist with a cash shortage.
Add a separate calendar of expected receipts and payments. State customer collection terms, supplier deadlines, and the minimum cash balance required for operations. Then test whether a delayed payment or an earlier supplier bill creates a funding gap. Do not hide that gap inside an annual growth assumption.
This is also a useful personal-finance distinction. Expected future income is different from money currently available to pay a bill. A projection may be relevant to planning, but should not silently become a claim that funds already exist.
Choose decision triggers before the next headline
A scenario is most useful when linked to an action. For the hypothetical business, management might review an expansion if order volume falls below a chosen threshold for two consecutive months. It might obtain fresh supplier quotes before renewing a long contract. The thresholds must reflect its real constraints; the examples here are proposed process choices, not universal rules.
Specify who owns the decision and when it will be reviewed. Avoid reacting to every macroeconomic headline if the business evidence has not changed. Conversely, do not wait for a major forecast revision when your actual order book already signals a problem.
Keep an assumption log with three columns: the current input, the evidence behind it, and what would make you revise it. This turns uncertainty into an organised review process. It also makes disagreements productive: colleagues can argue about an input or trigger rather than vaguely disagreeing about whether the economy feels strong.
Frequently asked questions
Should I wait for a new report before making any decision?
Not automatically. Decisions have their own deadlines. Use the latest verified information available, record its age, and consider whether the decision can be staged or reversed. Waiting also has a cost, which should be considered explicitly.
Can I average several forecasts and call that a probability?
A simple average can summarise point estimates, but it does not create a probability distribution. Differences in dates, assumptions, definitions, and shared information must be considered before combining figures. A range of published estimates is not automatically a confidence interval.
Where do I find the newest verified IMF release?
Start with the official WEO publication index, then check the dated issue and accompanying documentation. On October 12, the scheduled October 13 full report remains a future release for this article's purposes.
Sources and scope
Primary references are the IMF Annual Meetings calendar, the October 2026 WEO publication schedule, the WEO FAQ, the WEO database disclaimer, and the WEO publication index. The disclaimer notes that historical series may be revised and staff estimates may substitute where information is incomplete. The scenario framework, figures, table, and code are original explanatory material. They are not IMF projections or personalised financial advice.