Global EV Outlook 2026: What 23 Million Electric Car Sales Would Mean
The IEA expects around 23 million electric car sales in 2026. Explore regional differences, affordability, charging, and what forecasts cannot guarantee.
Electric vehicles have become an ordinary shopping decision in some markets and a difficult infrastructure decision in others. Both realities are visible in the International Energy Agency's Global EV Outlook 2026, published on 20 May 2026.
The IEA reported that global electric car sales exceeded 20 million in 2025, roughly one quarter of new cars sold. It projected around 23 million sales in 2026, or about 28% of the market. That is a forecast, not a final 2026 result. The difference matters whenever a headline says electric cars “will” reach a number that is still uncertain.
Global growth hides local reversals
The IEA's early-2026 data showed global electric car sales falling around 8% year on year in the first quarter, driven largely by China and the United States after policy changes. But the same period brought growth of roughly 30% in Europe, 80% in Asia Pacific excluding China, and 75% in Latin America.
A single global growth rate therefore obscures the questions most relevant to buyers and manufacturers: What is the local purchase price? Is home charging possible? How reliable is the grid? What happens to incentives? Can the vehicle be serviced locally?
| Indicator | IEA figure | How to read it |
|---|---|---|
| Global electric car sales, 2025 | More than 20 million | Reported historical outcome |
| Global electric car sales, 2026 | Around 23 million | Forecast as of May 2026 |
| EV share of global car sales, 2026 | About 28% | Forecast, not measured full-year share |
| Q1 2026 global EV sales growth | About -8% year on year | Short-term result, not full-year trend |
These figures refer to electric cars, not all electrified transport. Two- and three-wheelers can have very different economics and adoption patterns.
Affordability is more than the sticker price
Consider two drivers. One can charge overnight at home, drives predictable distances and keeps a vehicle for years. The other rents an apartment without charging access and relies on public fast chargers. The same model can produce different lifetime costs for them.
A basic total-cost-of-ownership comparison should include purchase price, financing, taxes, electricity or fuel, maintenance, insurance, charging installation, expected depreciation and resale uncertainty. Use local prices rather than copying assumptions from another country.
An illustrative framework:
Annual operating savings = annual fuel spending avoided − annual electricity spending − any additional recurring EV costs.
This is only one part of the ownership calculation. A lower operating bill may not offset a much higher purchase price over a short ownership period.
The engineering constraint is system-wide
More EVs require more than battery factories. Charging locations need suitable grid connections, installation permits, uptime monitoring, payment systems and customer support. The vehicle also depends on software, thermal management, battery durability and repair ecosystems.
Charging quality should be measured by whether drivers can reliably complete a journey, not simply by the number of chargers announced. A station that is regularly unavailable offers less practical value than its listing suggests.
What the forecast means for businesses
Fleet operators can run route-level pilots before buying hundreds of vehicles. Property managers can assess electrical capacity and tenant demand. Retailers can examine charging dwell time. Governments can compare support for vehicles with investment in grids, public transport and urban design.
For investors, rapid sales growth does not automatically imply attractive returns for every manufacturer. Competition, price cuts, capital expenditure and policy changes can squeeze margins even while adoption rises.
What to watch next
The useful indicators are not only total sales. Follow average transaction prices, model availability, charging reliability, local policy changes and fleet economics. Treat forecasts as scenarios to update, not promises to build a budget around.
FAQ
Are 23 million EV sales already confirmed for 2026?
No. The IEA's May 2026 figure is a projection.
Does the global EV share describe Indonesia or every other country?
No. National markets differ substantially in price, policy, charging access and consumer preferences.
Sources and further reading
Editorial notes
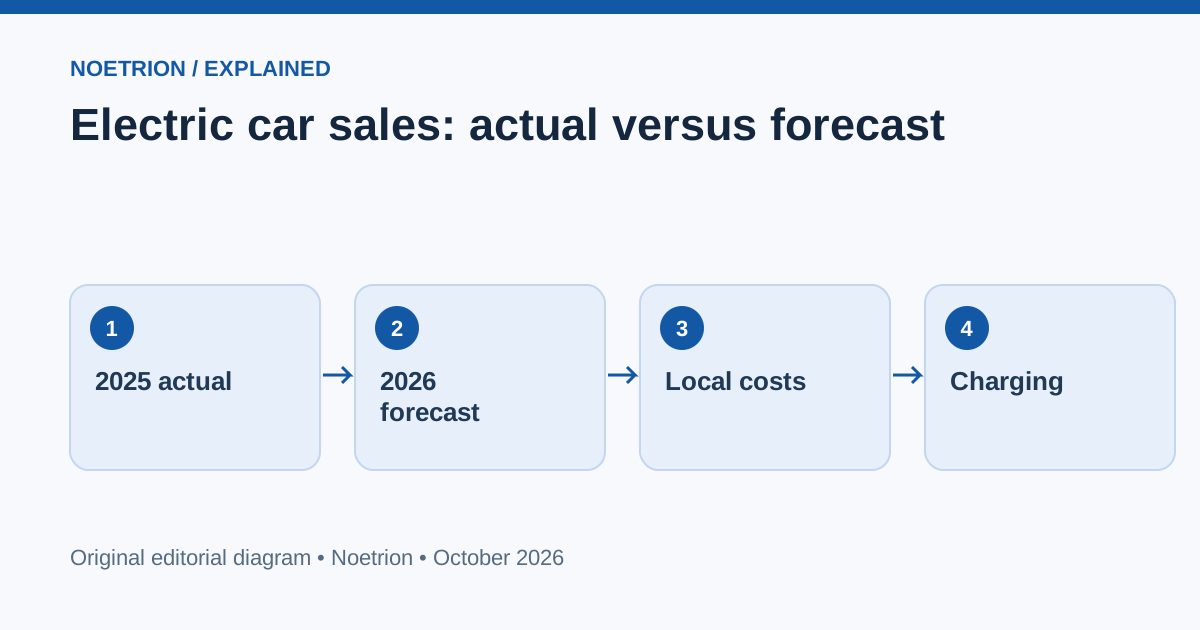
Visual: Electric car sales: actual versus forecast. Original bar graphic comparing over 20 million electric cars sold in 2025 with the IEA forecast of around 23 million in 2026; the 2026 value is a forecast, not observed sales.
Verification note: Facts were checked against the linked primary or specialist sources on 13 October 2026. Forecasts are labeled as forecasts, illustrative calculations as hypothetical, and the article does not constitute personalized legal, medical, or investment advice.