Economic Forecast Revisions: Build a Small Business Scenario Notebook
Keep forecast vintages separate, calculate revisions in percentage points, and translate uncertainty into an explicit order-and-cost scenario model.
A forecast revision is information about what an institution believed at a particular time. If you overwrite last month’s estimate with the latest one, you lose the evidence needed to understand how expectations changed. A simple notebook should preserve each release and separate the economic forecast from your business assumptions.
For historical context, the World Bank’s June 11, 2026 release projected global growth of 2.5% for 2026. That is a dated forecast, not a reading of completed 2026 output or a small business’s future revenue. The notebook below uses synthetic forecast records and business scenarios so you can reproduce the method without relying on an API or a particular institution’s next release.
Create a vintage record you can inspect
| Field | Example question |
|---|---|
| Institution and source | Which publication or table supplies the figure? |
| Release date | When was this forecast available to a reader? |
| Target period | Which year or quarter does it predict? |
| Geography and measure | Global or local, real or nominal, and how aggregated? |
| Value and unit | Is the number a growth rate, level, or index? |
| Assumptions | Which risks or conditions accompany the estimate? |
Compare revisions only when the measure, geography, target period, and method are compatible. A newly released estimate for next year is not a revision to this year. Nor is the difference between two institutions automatically a change in one institution’s outlook.
Calculate the revision in the right unit
Imagine a fictional regional forecast for the same target year changes from 8.0% in one release to 6.5% in a later release. The revision is −1.5 percentage points. The relative change in the quoted rate is (6.5 − 8.0) / 8.0 = −18.75%. Those expressions are different. Saying growth fell by 1.5% would leave the unit ambiguous.
Keep both records, then add the revision as a derived field. Use the original release documents to explain a real revision; the numerical difference alone does not identify whether energy, trade, financing, methodology, or another assumption caused it.
Translate uncertainty through local drivers
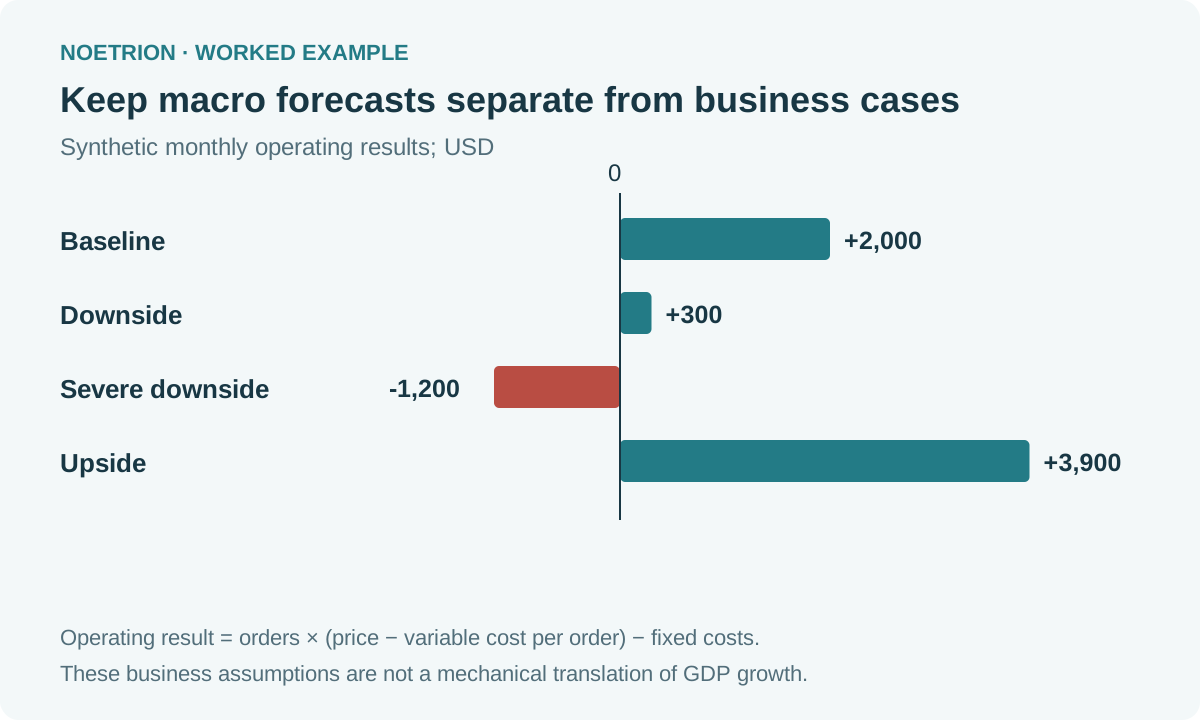
For a synthetic retailer, use order volume, selling price, variable cost per order, and monthly fixed costs. Do not multiply revenue by the global GDP forecast and call it a local demand model. Customer mix, competition, prices, and supply constraints connect the broader economy to the business.
| Case | Orders | Price | Variable cost/order | Fixed costs | Operating result |
|---|---|---|---|---|---|
| Baseline | 1,000 | 20 | 12 | 6,000 | 2,000 |
| Downside | 900 | 20 | 13 | 6,000 | 300 |
| Severe downside | 800 | 20 | 14 | 6,000 | −1,200 |
| Upside | 1,100 | 20 | 11 | 6,000 | 3,900 |
Operating result equals orders × (price − variable cost) − fixed costs. These results exclude taxes, financing, and other omitted items. They are scenario outputs, not assigned probabilities, and profit does not establish when the business receives or pays cash.
Reproduce the calculation in Python
cases = {
    "baseline": (1000, 20, 12, 6000),
    "downside": (900, 20, 13, 6000),
    "severe_downside": (800, 20, 14, 6000),
    "upside": (1100, 20, 11, 6000),
}
expected = {
    "baseline": 2000,
    "downside": 300,
    "severe_downside": -1200,
    "upside": 3900,
}
for name, (orders, price, variable, fixed) in cases.items():
    result = orders * (price - variable) - fixed
    assert result == expected[name]
    print(name, result)
The example was checked with Python 3.12.14 and needs no external package. Change one input at a time before combining shocks. Otherwise, you may identify a weak outcome without knowing which assumption drives it.
Define observations that would change the plan
Beside each scenario, write the local evidence that would support or weaken it: order intake, cancellations, supplier quotes, credit terms, and customer payment timing. Choose review triggers appropriate to the business rather than inventing a universal economic threshold.
Archive the current assumptions before updating them. Your notebook should show the forecast vintage, local evidence, model inputs, resulting margins, and decision changed. That record makes later correction possible without rewriting what was known at the time.