Government Debt: Why Higher Bond Yields Hit the Budget Slowly
Understand how bond yields reach government budgets, calculate debt dynamics, and build a fiscal-space worksheet without mistaking a model for a forecast.
A bond yield can jump this afternoon while the government's interest bill takes years to reflect it. That delay explains a common puzzle in economic reporting: financing conditions look worse, yet the budget numbers have barely moved. It also explains why a reassuring current interest bill can hide a difficult refinancing schedule.
The useful question is not simply whether public debt is high. Ask how much must be refinanced, at what rate, how quickly national income is growing, and how much revenue remains after existing commitments. These are different questions, and combining them into one frightening debt headline makes decisions harder.
What the October 2026 IMF warning actually says
The IMF's official October 14 Fiscal Monitor briefing overview reports that global public debt reached 94% of GDP in 2025 and projects 100% by 2029. It identifies rising interest burdens and spending pressures as sources of strain. Those are a historical aggregate and a forecast, respectively—not observations that every country has crossed the same threshold.
This article uses that published briefing overview for the current debt warning. The worked examples below explain mechanisms rather than reproduce a country forecast. The separately accessible October analytical chapter page concerns tax design and growth. Its argument includes improving tax neutrality and administration rather than assuming every revenue problem requires a higher headline tax rate.
The practical implication is narrower than “a crisis is inevitable.” Governments need room to absorb shocks, and financing costs affect that room. Timing and the composition of debt determine how quickly the pressure arrives.
Separate the stock, the flow, and the price
Debt is a stock measured at a point in time. A deficit is a flow over a period. A bond yield is a price of financing traded or newly issued debt. An interest bill is a payment arising from the debt already outstanding. They move together imperfectly.
| Measure | What it answers | A frequent misreading |
|---|---|---|
| Debt-to-GDP ratio | How large is debt relative to annual economic output? | Treating GDP as money available to pay creditors |
| Primary balance | Does revenue cover spending before interest? | Confusing it with the overall balance |
| Interest-to-revenue ratio | How much collected revenue goes to interest? | Assuming a low debt ratio guarantees a low burden |
| Gross financing need | How much new borrowing and refinancing is required? | Looking only at the annual deficit |
| Average effective interest rate | What is the outstanding portfolio costing? | Substituting today's market yield |
A country with moderate debt but short maturities can face a faster financing shock than a country with longer fixed-rate borrowing. Foreign-currency debt adds another channel: depreciation can raise its domestic-currency value even before any new loan is taken out.
Work through a refinancing ladder
Consider a fictional government with debt of 800 currency units, all initially paying a fixed 3% annual rate. Its annual interest bill is 24. Suppose 160 units mature each year and are refinanced at 6%. Ignore new deficits, early buybacks, exchange-rate movements, and fees for this first illustration.
Each yearly refinancing replaces interest of 4.8 with 9.6, adding 4.8 to the annual bill. The market shock has happened immediately; the portfolio reprices in steps.
| End of year | Debt still at 3% | Debt refinanced at 6% | Annual interest bill | Effective rate |
|---|---|---|---|---|
| Before refinancing | 800 | 0 | 24.0 | 3.0% |
| 1 | 640 | 160 | 28.8 | 3.6% |
| 2 | 480 | 320 | 33.6 | 4.2% |
| 3 | 320 | 480 | 38.4 | 4.8% |
| 4 | 160 | 640 | 43.2 | 5.4% |
| 5 | 0 | 800 | 48.0 | 6.0% |
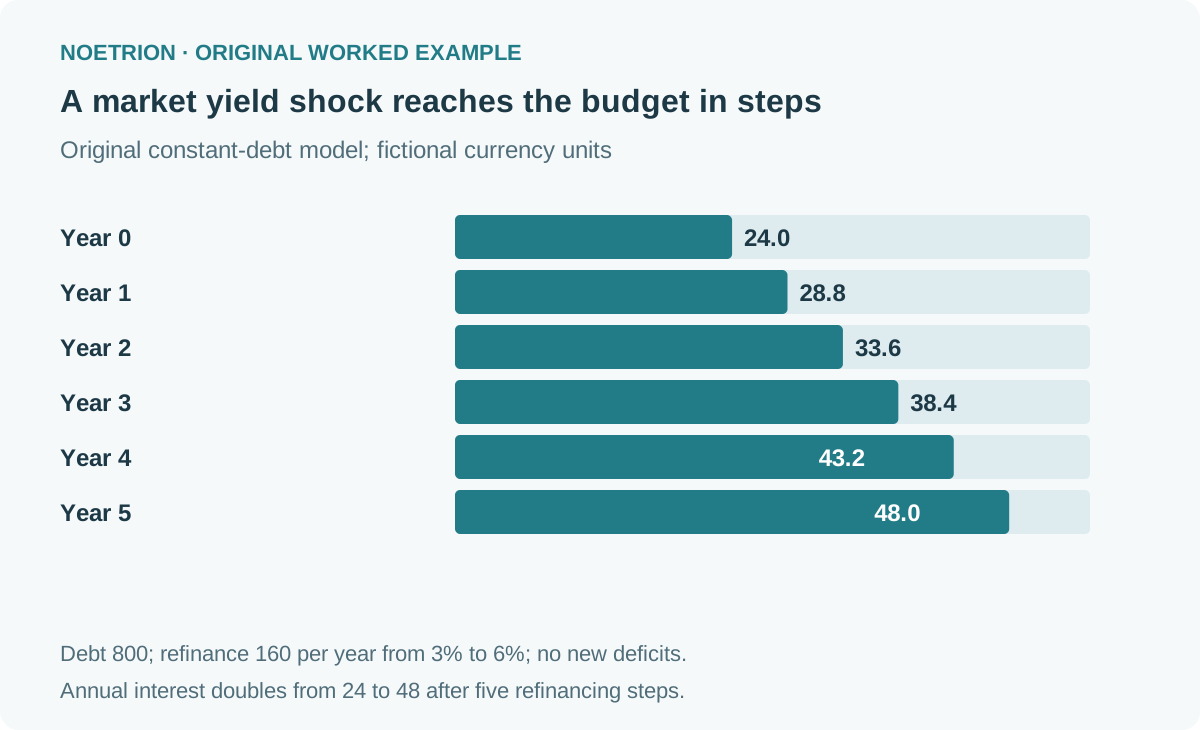
If revenue stays at 200, interest consumes 12% initially and 24% after complete repricing. If revenue grows, that burden changes. If debt expands, it changes again. The ladder isolates one mechanism so it can be understood before introducing those complications.
Growth changes the denominator, not the invoice
The ratio can fall even when debt rises. Starting with debt of 800 and GDP of 1,000 gives an 80% ratio. Suppose the effective nominal interest rate is 5%, nominal GDP grows 4%, and the primary surplus equals 1% of current-year GDP.
Current-year GDP becomes 1,040. Interest adds 40 to debt, while the primary surplus removes 10.4. End-year debt is 829.6, giving a ratio of 79.77%. Debt increased in currency units but declined relative to output.
For this simplified model, let b be the previous debt-to-GDP ratio, i the effective nominal interest rate, g nominal GDP growth, and p the primary surplus divided by current-year GDP:
new debt ratio = ((1 + i) / (1 + g)) × b − p
The IMF's explanation of debt sustainability identifies the primary balance, growth, rates, and debt levels as key inputs. The simplified equation here deliberately excludes other debt-creating flows and stock-flow adjustments. Use nominal interest with nominal growth; mixing a nominal rate and real growth overstates the apparent interest-growth gap.
At 5% interest and 4% growth, an 80% starting ratio needs a primary surplus of about 0.769% of current GDP merely to remain stable. That is ((0.05 − 0.04) / 1.04) × 0.80. Stability is not the same as reducing debt or creating a safe buffer.
A small change can reverse the direction
Now hold the same 80% starting ratio and 1% primary surplus, but use a 6% effective rate and 2% nominal growth. The next ratio is 82.14%. The surplus needed for stability rises to about 3.137% of GDP.
This calculation does not predict that a government can painlessly collect that surplus. Taxes affect households and investment; spending cuts affect services and demand. Growth itself can respond to policy. A spreadsheet that treats growth as fixed after a large fiscal adjustment misses that feedback.
For the same reason, avoid using debt arithmetic to rank investment opportunities automatically. A rising ratio does not identify when markets will react, what exchange rates will do, or which bond price is attractive. It identifies assumptions that deserve closer scrutiny.
The most helpful sensitivity test changes one input at a time. First change refinancing rates, then growth, then the primary balance. After understanding each mechanism, consider combinations. Record whether an input is historical, a government plan, an institutional projection, or your own assumption.
Build a fiscal-space worksheet
A usable worksheet should make uncertainty visible rather than conceal it behind a single score.
| Worksheet field | Information to collect | Why it matters |
|---|---|---|
| Debt perimeter | Central or general government; gross or net | Prevents comparing different definitions |
| Maturity schedule | Principal due by year | Reveals refinancing concentration |
| Rate structure | Fixed, floating, and inflation-linked shares | Shows repricing speed |
| Currency structure | Domestic and foreign-currency shares | Identifies exchange-rate exposure |
| Revenue base | Actual collections and forecast assumptions | Places interest costs in budget context |
| Contingent commitments | Guarantees and other disclosed exposures | Captures risks outside the headline stock |
| Primary balance | Actual result and proposed path | Separates policy choices from interest costs |
Start with the finance ministry's debt bulletin and budget documents. Keep units consistent and put a date next to every entry. Do not combine a year-end debt stock with a revenue forecast from a different budget vintage without explaining the mismatch.
Where a maturity schedule is missing, mark it missing. An average maturity cannot reveal whether a large payment is concentrated in one particular year. Where a liability is uncertain, describe the trigger instead of converting it into a definite cost.
Translate the analysis into practical decisions
For a business selling to government, exposure depends on contracts, payment terms, and project priorities. Review concentration and the conditions under which a contract can be delayed. A global debt projection alone does not prove that your invoice will be paid late.
For a household, the connection is more indirect. Fiscal decisions may affect taxes, transfers, public services, or borrowing conditions, but those channels differ by jurisdiction. Prepare for plausible changes in your own cash flows rather than treating a global ratio as a personal financial instruction.
For a student or analyst, produce a one-page note with three parts: the observed debt structure, the mechanism through which costs could change, and the missing information that would alter your interpretation. That note is more defensible than a dramatic prediction with no maturity data.
Update the worksheet when a new budget or debt bulletin appears. Keep the previous version so a revision is distinguishable from a real change. The point is to notice pressure early enough to ask better questions, while retaining the humility that a simplified model requires.
The economic data revisions guide provides a companion workflow for retaining data vintages.
Sources and verification notes
- IMF October 14, 2026 Fiscal Monitor briefing overview: current aggregate debt warning and forecast; not a full chapter review.
- IMF October 2026 analytical chapter landing page: tax design mechanisms.
Sources checked October 14, 2026. Every refinancing and debt-ratio example above is synthetic. Calculations were independently recomputed; omitted stock-flow and currency adjustments limit their use as real-country projections.