How a Hedge Fund Margin Call Can Become a Market Liquidity Spiral
Read the IMF's October 2026 hedge fund warning through a worked collateral example showing how price losses, higher haircuts, and forced sales interact.
Educational analysis, not a personal investment or payment recommendation. Check the dated sources and the rules that apply in your jurisdiction.
A fund can still own assets worth more than its debts and nevertheless be unable to deliver the cash demanded by a lender this afternoon. That gap between balance-sheet value and immediately available funding is central to a margin-driven market disruption.
The IMF's October 2026 Global Financial Stability Report examines hedge funds in Chapter 2, released October 6 ahead of the full report's October 13 launch. Here, a worked example shows how financing can turn a price move into a much larger sale.
Read the October report at the right level
The IMF's October 6 chapter briefing identifies leverage, crowded positions, and investor withdrawal pressure as interacting vulnerabilities. It describes borrowing through repos, prime brokers, and derivatives, and links tighter financing or rising volatility to margin calls and rapid unwinds.
The October 13 official launch briefing reiterates that hedge funds can support markets while leverage and crowded trades amplify stress. This article explains that mechanism. It does not turn a risk scenario into a prediction of a crash or a recommendation about a particular investment.
The IMF report landing page returned launch-schedule information when checked. The current findings used here come from the dated official briefings; the numerical example below is entirely synthetic.
Separate leverage, margin, and liquidity
Leverage increases exposure relative to capital. Collateral requirements protect counterparties. Liquidity concerns whether required cash or acceptable assets can be delivered on time.
| Concept | Question it answers | Synthetic illustration |
|---|---|---|
| Balance-sheet leverage | How much asset exposure is supported by equity? | $104m assets divided by $7m equity: about 14.9 times |
| Repo haircut | How much of collateral value will the lender finance? | 3% haircut means lending $97 against $100 collateral |
| Variation margin | What payment follows a change in a derivative's value? | A losing position may require a cash transfer |
| Initial margin | What buffer covers potential future closeout exposure? | A volatility-driven increase can require additional collateral |
| Funding liquidity | Can obligations be met on time? | $4m available cash against a $5.8m repayment demand |
| Market liquidity | Can a position be sold without a large price concession? | Many sellers competing for limited buying capacity |
A repo is secured financing using securities. Here, the haircut sets maximum borrowing against current collateral value. Actual agreements differ in timing, valuation, eligibility, netting, and renewal terms.
Start with a fully specified collateral position
Assume a fund buys a bond position worth $100 million. A lender finances $97 million against it at a 3% haircut. The fund also holds $4 million of unencumbered cash. Total assets are $104 million; debt is $97 million; equity is $7 million. Ignore interest, taxes, derivatives, and other liabilities.
Now suppose the bonds fall 4%, to $96 million. At the same time, assume the financing agreement permits a higher haircut on renewal, increasing it to 5%. Both assumptions are chosen to expose the mechanism. They are not estimated typical haircuts or an IMF stress-test calibration.
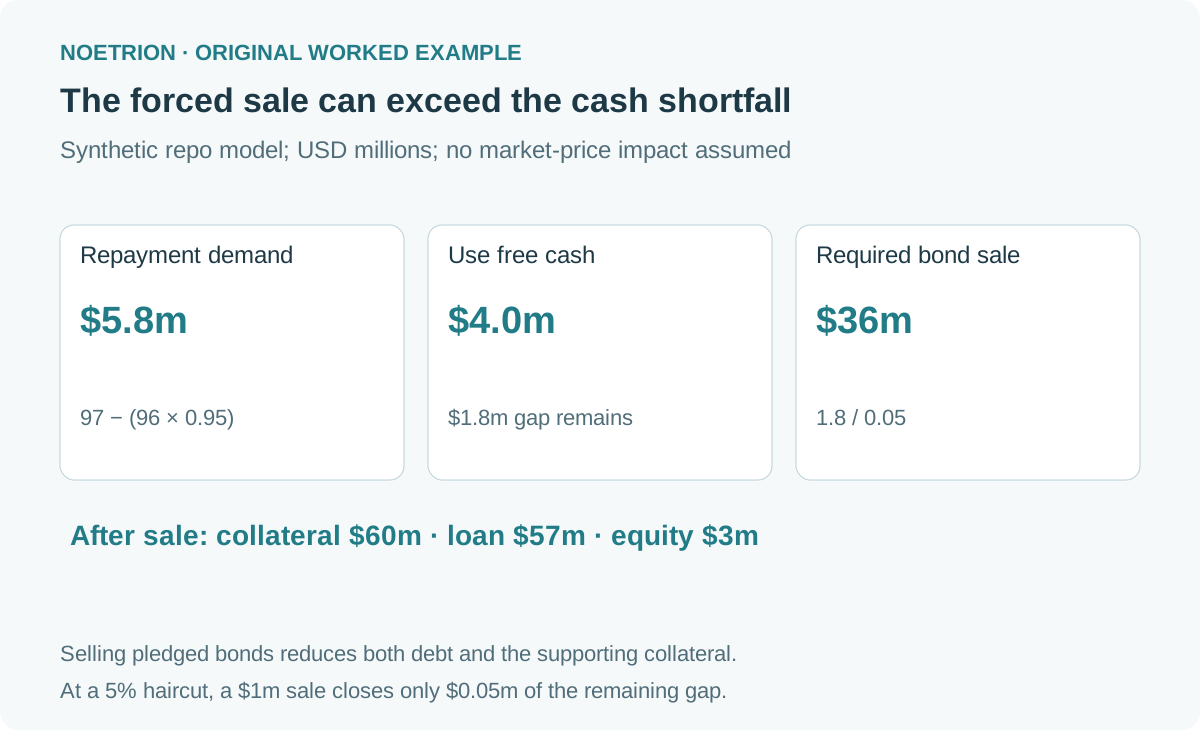
The renewed maximum loan is $96m × 95% = $91.2m. The old $97m loan must therefore shrink by $5.8m. At an unchanged 3% haircut, the price move alone would require $3.88m. The higher haircut adds another $1.92m because 2% of the remaining $96m collateral is no longer financeable.
| Stage | Bonds | Free cash | Loan | Equity |
|---|---|---|---|---|
| Before price shock | $100m | $4m | $97m | $7m |
| After 4% price loss, before repayment | $96m | $4m | $97m | $3m |
| After using all cash to repay debt | $96m | $0m | $93m | $3m |
| After selling $36m bonds and repaying proceeds | $60m | $0m | $57m | $3m |
The fund remains solvent in this model after the price shock: its $100m assets exceed its $97m loan. But the collateral rule permits only $91.2m of lending. Positive equity does not deliver the missing funding.
Why the sale can be far larger than the shortfall
The fund uses all $4 million cash to repay the lender. The loan drops to $93 million, leaving a $1.8 million deficiency against the $91.2 million limit. It then sells collateral and uses every dollar of proceeds to repay debt.
Here is the easily missed point: selling financed bonds also reduces the collateral supporting the remaining loan. A $1 million sale reduces debt by $1 million but reduces permitted borrowing by $950,000 at a 5% haircut. Only $50,000 of the sale closes the deficiency. The required sale is therefore $1.8m ÷ 5% = $36 million.
Algebra makes the constraint visible. If the fund sells an amount S at the current marked price, debt becomes 93 − S and remaining collateral becomes 96 − S. The condition is:
93 − S ≤ 0.95 × (96 − S)
This gives S ≥ 36, with all amounts in millions. After that sale, $60m collateral supports exactly $57m debt. Equity remains $3m because selling at the marked price and repaying debt creates no additional trading loss. The sale reduces the position's size, not the loss already recorded.
If the fund had no available cash, meeting the same rule by selling only these bonds would require $5.8m ÷ 5% = $116m, more than the entire $96m position. A sale alone could not cure the deficiency. It would need another source of funds, a negotiated change, or some other resolution.
Add price impact and the arithmetic worsens
The $36 million result assumes sales execute at the existing mark without moving the market. If multiple funds sell similar positions, bids can deteriorate. Falling prices then reduce other funds' collateral values, producing more financing demands.
For a second synthetic sensitivity, suppose the entire remaining bond position is repriced another 1% before any sale, from $96m to $95.04m. After the same $4m cash repayment, allowable debt is $90.288m; the deficiency is $2.712m. With a 5% haircut, the required sale rises to $54.24m. This is a separate scenario, not an extra cost mechanically added to the first completed sale.
Our scenario illustrates one financing channel behind the IMF's synchronized-unwind mechanism. It omits new buyers at lower prices, hedge performance, and lender negotiation; each can change the outcome.
A hedge can reduce risk and still create a cash deadline
Consider a fund holding a bond and an offsetting futures position. Their economic values may broadly offset, but their cash movements can arrive on different schedules. A futures loss can demand payment today while the gain on the cash bond remains an unrealized value change. Net economic exposure and gross cash obligations are different measurements.
Likewise, a credit line is useful only if it is available, drawable in the required currency, and not conditional on the same deteriorating collateral. “Liquid assets” need operational detail: which account holds them, whether they are pledged, when a sale settles, and whether they are eligible at the counterparty requesting margin.
The FSB's liquidity preparedness recommendations call for liquidity stress tests, contingency funding arrangements, and effective collateral operations. Those controls address the deadline behind the balance sheet, rather than merely counting assets that look saleable under ordinary conditions.
Examine the whole system's response
One lender demanding a larger buffer may reduce its own exposure. Many lenders tightening simultaneously can create a shortage of buyers as clients all try to sell. Reviewing each institution independently can miss this shared pressure.
The Bank of England's July 17 repo analysis discusses this trade-off in gilt markets and describes central clearing and minimum haircuts as reforms under consideration. It also notes that collateral demands can rise in bilateral markets. These are design questions; the article does not establish that one financing structure automatically eliminates stress.
For an analyst, a practical scenario worksheet should specify starting equity, gross exposures, unrestricted cash, haircut-change rights, renewal dates, margin currencies, settlement times, and common holdings across funds. Recalculate the cash demand before choosing an assumed asset sale. Then test whether proceeds arrive before the deadline and whether the collateral released by the sale creates another funding requirement.
Finish with a funding map, not a crash prediction
The most useful takeaway from the October report is a conditional chain: a price shock can trigger a collateral demand; an insufficient cash buffer can trigger a sale; crowded sales can worsen prices and trigger further demands. Breaking that chain requires understanding actual agreements and cash timing.
Reproduce the scenario, change one assumption at a time, and label what remains outside the model. Every result depends on the financing terms and available cash. For monetary arithmetic, see Python Decimal and rounding money.
Primary sources, checked October 14, 2026: