Most Stocks Can Rise While the Index Falls: Read the Weights Before the Headline
Understand why a weighted stock index can fall when most constituents rise. Calculate contributions, compare equal weighting and avoid misleading breadth claims.
Educational analysis, not a personal investment or payment recommendation. Check the dated sources and the rules that apply in your jurisdiction.
You read that the market fell, then notice that many individual stocks rose. The statements do not necessarily conflict. An index is a calculation over a defined set of securities, and the size of each security's influence depends on its weighting method.
This distinction is useful during periods when attention is concentrated on large AI-related companies. A headline about a technology-led sell-off does not tell you what happened to the typical constituent, much less to every investor's portfolio. To understand the result, separate the index return from market breadth.
S&P Dow Jones Indices' methodology explainer describes market-capitalization, float-adjusted and equal weighting. The example below is original, with five fictional stocks and no dividends or corporate actions. It is educational analysis, not an investment recommendation or a reconstruction of a particular trading day.
Ask which index and which return
The word market can refer to a country benchmark, a sector, a global universe or a few widely followed stocks. Start by naming the exact index and the period. A daily change and a year-to-date change answer different questions.
Then distinguish price return from total return. A total-return calculation includes distributions according to its methodology; a price index does not capture them in the same way. Compare like with like before concluding that one market or product performed better.
The number of index points is also different from the percentage return. A hundred-point move has a different percentage meaning at an index level of 2,000 than at 20,000.
Define breadth separately
Breadth can describe how many securities advanced, declined or remained unchanged. The exact universe and treatment of unchanged securities should be stated. Counting companies and weighting their returns are different operations.
| Measure | Basic question | What it does not establish |
|---|---|---|
| Weighted index return | What happened to the defined weighted basket? | The fraction of stocks that rose |
| Advancing share | How many constituents had a positive return? | The size of their economic influence |
| Equal-weight return | What happened under equal starting weights? | The return of a market-cap basket |
| Median stock return | What happened to the middle observation? | The return on an investable portfolio |
These measures can complement one another. None should silently substitute for another because it makes the day's story more dramatic.
Calculate the weighted result
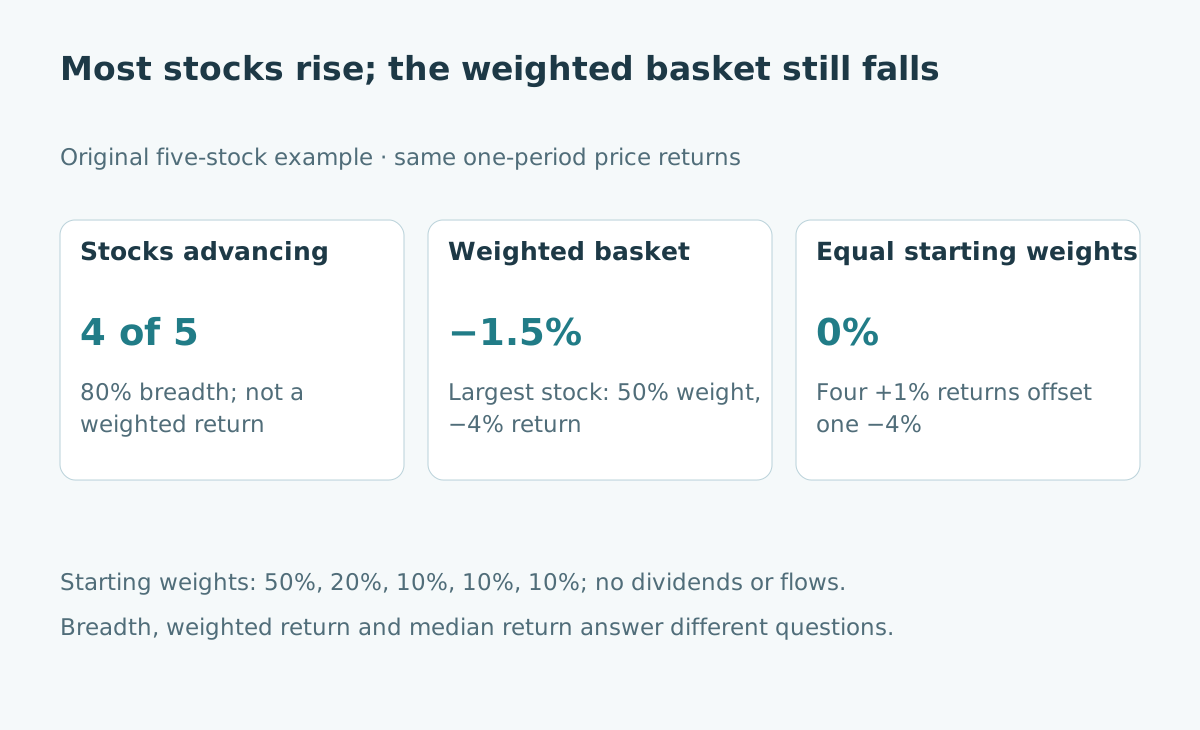
Suppose the largest stock has 50% of the starting basket, the second 20%, and the other three 10% each. The largest falls 4%; all four others rise 1%.
| Fictional stock | Starting weight | Period return | Contribution to basket return |
|---|---|---|---|
| A | 50% | −4% | −2.0 percentage points |
| B | 20% | +1% | +0.2 percentage points |
| C | 10% | +1% | +0.1 percentage points |
| D | 10% | +1% | +0.1 percentage points |
| E | 10% | +1% | +0.1 percentage points |
| Total | 100% | — | −1.5 percentage points |
Four of five stocks rose, so the advancing share is 80%. The weighted basket fell 1.5%. A $1,000 basket following these starting allocations ends at $985 before costs and distributions.
The calculation uses the sum of starting weight multiplied by each period return. Real index maintenance includes additional rules; the S&P index mathematics methodology is the appropriate reference for those details.
Compare equal starting weights
If the same five stocks each begin at 20%, the one-period return is 0.20 × (−4% + 1% + 1% + 1% + 1%) = 0%. The median individual return is +1%.
Neither result refutes the market-cap-style basket. They describe different weight structures or statistics over the same observations. Equal weighting is not a free improvement: it changes exposures, and maintaining it over time can require rebalancing and incur costs.
Be precise about timing. An equal-weighted portfolio generally drifts away from equal weights as prices change between rebalances. A calculation using equal starting weights for one period is not permission to assume continuous costless rebalancing.
Separate contribution from causation
In this example, stock A contributed −2 percentage points to the basket. That is an arithmetic attribution. Explaining why A fell is a different task requiring evidence about news, expectations and trading conditions.
A report can accurately identify the largest negative contributor while offering a speculative causal explanation. Keep those claims separate. A company's earnings release and the market's response are related observations, but a price move may reflect multiple changes in expectations.
Likewise, a correlation between several technology stocks does not establish that one caused the others to fall. Exposure to common factors can create simultaneous movements.
Check concentration in a portfolio
A portfolio holding several funds may still share large underlying positions. Count exposures at the underlying-security level where the data are available, and preserve the date of holdings information. The number of fund names is not the number of independent risks.
Do not infer suitability from concentration alone. Different strategies intentionally choose different exposures. The practical task is to understand the exposure, its role and its possible downside, rather than treating a broad label as a guarantee of diversification.
This article does not estimate future returns. A concentrated basket can outperform or underperform over a chosen period. Today's breadth statistic is not a dependable timing rule by itself.
Read the next headline with a short worksheet
Record the index, period, return type, weighting method and advancing share if reported. Identify whether the explanation discusses contribution, cause or prediction. Ask which figures are measured and which are interpretation.
As a self-check, an index falls 2% while 60% of constituents rise. Is the breadth statistic necessarily wrong? No. Larger negative contributions from heavily weighted constituents can outweigh smaller positive contributions from the rest.
For the accounting behind company-level stories, continue with capital expenditure and cash flow. Market prices, reported earnings and cash generation each provide a different view.
Sources and limits
- S&P Dow Jones Indices: Methodology Matters: weighting and index construction.
- S&P Index Mathematics Methodology: calculation framework.
Checked October 23, 2026. All securities, weights and returns in the worked example are fictional. No current constituent weights or market return forecast is asserted.