The Part Is Inside Tolerance. Is the Measurement Good Enough to Accept It?
Use a worked uncertainty budget and guard-band example to distinguish manufacturing tolerance, measurement quality, and an agreed acceptance decision rule.
A drawing permits a diameter from 9.950 to 10.050 millimetres. An instrument reports 10.040. The number sits inside the tolerance, so should the part pass?
The answer depends on the measurement uncertainty and the decision rule agreed for acceptance. The drawing defines the product requirement. It does not make the measurement exact, and a display with extra decimal places does not resolve that problem.
This distinction is useful in manufacturing, laboratory work, and data analysis wherever a measured value is compared with a limit. An October 2026 NIST report provides a timely reminder that credible engineering decisions need uncertainty information. The worked example below applies established measurement principles to a fictional inspection problem; it does not announce a new mandatory manufacturing rule.
A recent report, and an older practical problem
NIST published On Methods of Uncertainty Quantification in Computational Modeling and Simulation on October 5, 2026. Its abstract describes bringing modeling uncertainty and metrology practices together, with credibility work scaled to the influence of a model and the consequences of a decision.
A physical inspection faces a related practical question: how much confidence does the measurement support near a specification boundary? The connection is an editorial application of that broader lesson, rather than a claim that the new report prescribes the rule used here.
NIST's 2015 paper on decision rules discusses how measurement uncertainty and specification zones affect acceptance decisions. It is historical context, not evidence that every proposal described in 2015 is the current default in every industry. Real contracts should identify the applicable current specification and decision rule.
Keep tolerance, resolution, and uncertainty separate
Tolerance describes the acceptable product values. Resolution describes the smallest displayed or indicated change. Measurement uncertainty characterizes the dispersion of values reasonably attributable to the measurand under the stated model and information.
For the fictional diameter, the tolerance width is 0.100 mm. An instrument might display 0.001 mm steps while its overall uncertainty is substantially larger than 0.001 mm. Calibration, repeatability, temperature, alignment, sampling location, and other effects can matter beyond the final digit on the screen.
NIST's uncertainty overview emphasizes that measurement results are incomplete without appropriate uncertainty information. The practical implication is to ask for the result, the uncertainty, and the conditions together.
| Concept | Question it answers | Fictional example |
|---|---|---|
| Specification interval | What product values are allowed? | 9.950 to 10.050 mm |
| Display resolution | What increments can be shown? | 0.001 mm |
| Standard uncertainty | What uncertainty components enter the model? | Values in the budget below |
| Expanded uncertainty | What wider interval is reported with a coverage factor? | Approximately 0.0161 mm |
| Decision rule | How does uncertainty affect acceptance? | A stated guarded interval |
A measurement result and an acceptance decision belong in separate fields. Otherwise, changing a decision policy can look like changing the measured part.
Build a small uncertainty budget
Assume the measurement model is a sum of corrected diameter and residual additive effects. For this teaching example, all listed components are standard uncertainties, their sensitivity coefficients are one, and they are treated as uncorrelated. Those assumptions must be justified rather than copied into a real calibration report.
| Component | Standard uncertainty, mm | Squared contribution, mm² |
|---|---|---|
| Repeatability contribution | 0.006 | 0.000036 |
| Calibration contribution | 0.004 | 0.000016 |
| Temperature contribution | 0.003 | 0.000009 |
| Alignment contribution | 0.002 | 0.000004 |
| Sum of squared contributions | — | 0.000065 |
Following the uncorrelated special case of NIST's combination guidance, the combined standard uncertainty is the square root of the sum of squared contributions. Here, it is approximately 0.008062 mm.
Choose a coverage factor k = 2 for this simplified example. Expanded uncertainty is U = 2 × 0.008062, approximately 0.016125 mm. NIST's coverage explanation describes when a factor of two gives an interval with coverage near 95%. That interpretation depends on appropriate distributional and statistical conditions; it is not guaranteed merely by multiplying any number by two.
Define an illustrative guard band
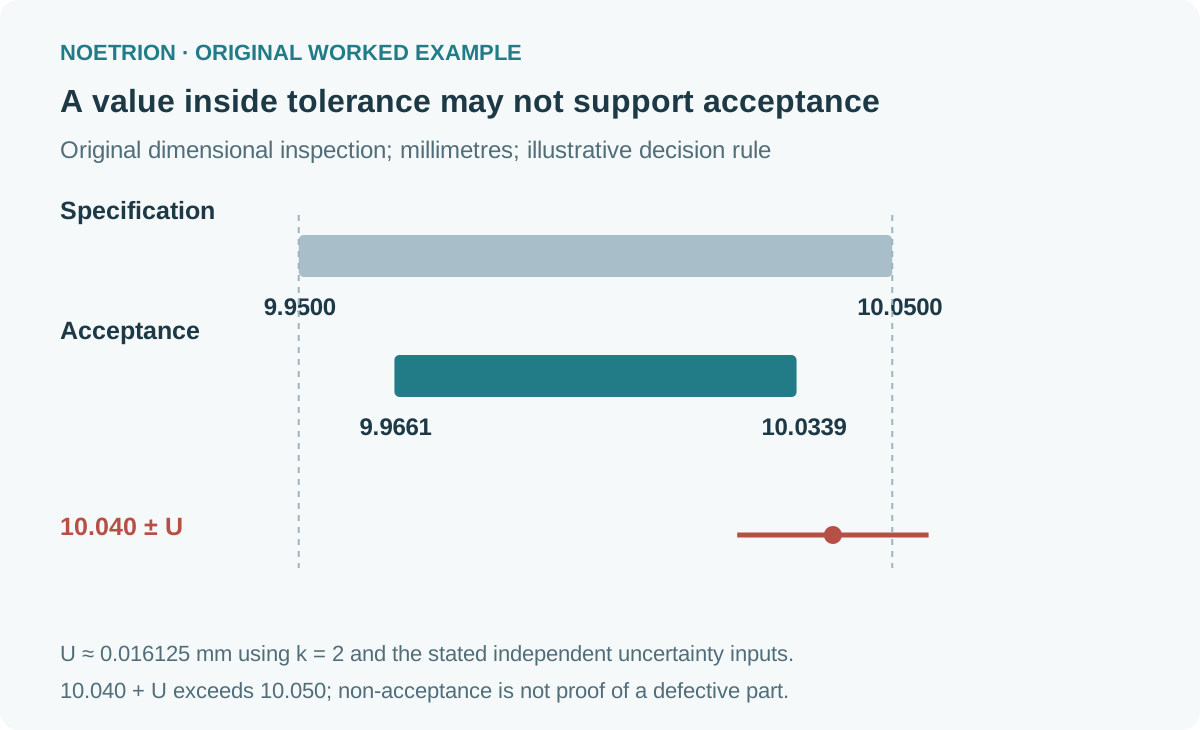
For this exercise, choose a conservative acceptance policy: accept only when the measured result plus or minus U fits entirely within the specification interval. This is an explicit example rule, not a universal requirement.
The lower acceptance limit becomes 9.950 + 0.016125 = approximately 9.966125 mm. The upper limit becomes 10.050 − 0.016125 = approximately 10.033875 mm. The product specification remains 9.950 to 10.050; the acceptance interval is narrower because the measurement is uncertain.
A result of 10.030 has an upper interval endpoint of approximately 10.046125, still below 10.050, so it meets the example rule. A result of 10.040 has an upper endpoint of approximately 10.056125, so it does not meet the guarded acceptance rule even though its central value lies inside tolerance.
That second result is not proof that the part is nonconforming. It means this measurement and rule do not support acceptance. A defined follow-up could be remeasurement with lower uncertainty, review under another contractually agreed rule, or another disposition authorized by the quality process.
Compare decisions without hiding the policy
Apply both a central-value-only rule and the guarded rule to six invented inspection results:
| Measured diameter, mm | Central value inside specification? | Meets example guarded acceptance? |
|---|---|---|
| 9.960 | Yes | No |
| 9.980 | Yes | Yes |
| 10.000 | Yes | Yes |
| 10.030 | Yes | Yes |
| 10.040 | Yes | No |
| 10.060 | No | No |
Five of six values lie within the drawing's interval, while three meet the guarded rule. These are decision counts for a constructed list, not estimates of factory yield or defect rates. Six selected readings cannot characterize a production distribution.
The difference also illustrates a trade-off. Guarding acceptance can reduce the chance of accepting a nonconforming product under an appropriate uncertainty model, but can increase the number of conforming parts that are not accepted on the available evidence. The right policy depends on risk, contractual obligations, and measurement capability.
A policy should therefore be agreed before inspecting a contentious batch. Selecting whichever rule produces the desired commercial answer after seeing the results undermines the purpose of the measurement.
Improve the dominant contributor first
The repeatability term contributes 0.000036/0.000065, or approximately 55.4% of the uncertainty variance in this example. Suppose an improved procedure reduces that standard uncertainty from 0.006 to 0.003 mm while the other terms stay unchanged.
The new variance sum is 0.000038 mm², giving combined standard uncertainty of approximately 0.006164 mm and expanded uncertainty of 0.012329 mm. The guarded interval widens to approximately 9.962329 to 10.037671 mm.
That improvement still does not accept 10.040 under the example rule. It does, however, improve the evidence for measurements near the boundary. This is a useful engineering result: a procedure can be materially better without solving every acceptance problem.
Repeated measurement is not automatically the cure. Averaging can reduce some random contributions under suitable conditions, but it does not eliminate a shared calibration error, temperature bias, or an unsuitable definition of the measurement location. The uncertainty budget helps identify which intervention addresses which contributor.
Check the independence assumption before reusing the budget
The square-root calculation above assumes uncorrelated contributions. Two measurements taken with the same reference or environmental correction can share an error source. Treating shared information as independent may make a combined result look more certain than the available evidence supports.
A practical budget therefore records why each contributor is included and whether it overlaps another term. Do not count the same temperature effect twice under different labels, and do not assume independence merely because two numbers appear on separate certificate lines. If correlations matter, the measurement model needs the corresponding covariance terms or another justified method. The simple example is useful precisely because its assumptions are visible.
Turn the calculation into a reproducible inspection record
A useful record includes part identity, drawing revision, measurand definition, instrument identity, corrections, environmental conditions, uncertainty budget version, result, and decision rule. Store the acceptance outcome alongside those inputs so another reviewer can reconstruct it.
Avoid premature rounding. Compare using the retained numerical precision, then display a sensible rounded result and uncertainty. A value that looks exactly on a rounded boundary may lie on either side before rounding, so the rule should specify how boundary cases are handled.
Also record what happened after a non-acceptance decision. A lower-uncertainty remeasurement should be a traceable new result, not an unexplained replacement of the original value. That preserves both process learning and accountability.
For students, a useful exercise is to change one uncertainty component and predict the direction of the acceptance interval before recalculating. Then explain why the product tolerance itself did not change. That distinction is the conceptual foundation of the worksheet.
The digital twin validation guide extends the same evidence discipline to modeled engineering outputs.
Sources and scope
- NIST, uncertainty modeling and metrology report, October 5, 2026; publication abstract reviewed.
- NIST, decision-rule paper, July 31, 2015; historical context.
- NIST, measurement uncertainty overview, combining components, and coverage factors.
Checked October 20, 2026. All part dimensions, uncertainty components, and decisions are synthetic. The worked rule does not substitute for an applicable standard, calibration service, or customer agreement.