Microplastics Measurement: Why Particle Counts Often Disagree
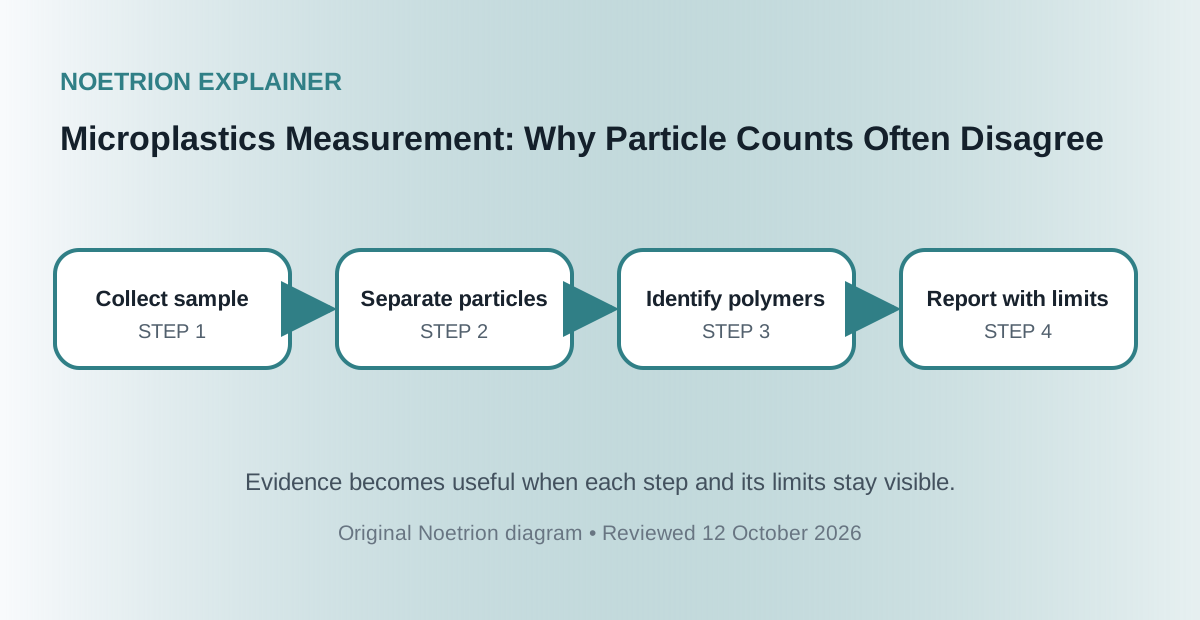
Follow a sample from collection to polymer identification and learn why mesh size, digestion, contamination, and reporting units can change the result.
Reviewed October 12, 2026.
Follow a sample from collection to polymer identification and learn why mesh size, digestion, contamination, and reporting units can change the result.
| Concept | What it means | Important limit |
|---|---|---|
| Operational definition | Size and material rules used by a study | Definitions vary across projects |
| Visual count | Particles selected by appearance | Fibres and natural material can be misclassified |
| Spectroscopy | Chemical signature used for identification | Small particles challenge sensitivity and throughput |
| Blank sample | Control for laboratory and airborne contamination | Correction rules must be reported |
1. “Microplastic” is an operational category
Studies commonly describe plastic particles below five millimetres, but lower size limits, inclusion of fibres, treatment of rubber or paint, and definitions of nanoplastics vary. Instruments do not observe every size equally. A result is therefore always “particles detected by this method under this definition,” not the complete amount of plastic present. Comparisons should begin with filter or mesh size, sampled volume or mass, particle classes, and polymer criteria. The unit alone cannot repair incompatible detection windows.
2. Sampling determines which environment is represented
A surface net samples a different slice of water than a pump at depth, a grab bottle, sediment core, beach transect, or biological tissue. Flow, weather, season, location, and particle buoyancy affect capture. Nets can miss small particles and fibres that pass through mesh. Containers and equipment can add or lose material. Replicates and field blanks help estimate variability and contamination. Metadata should make it possible to reconstruct where, when, how much, and with what materials a sample was collected.
3. Separation removes a complex matrix imperfectly
Environmental samples contain sand, salts, organic tissue, algae, and other particles. Density separation floats some polymers while denser plastics or particles with attached material may remain. Chemical or enzymatic digestion removes organic matter but can alter vulnerable polymers if conditions are harsh. Filtration concentrates material yet introduces size cutoffs. Recovery experiments add known particles to test how much the workflow retains. Without recovery data, a clean final filter may reflect efficient loss rather than a low environmental concentration.
4. Visual sorting is fast but vulnerable to bias
Researchers may classify fragments, fibres, films, or beads by color, texture, and response to tools. Natural fibres, paint, glass, and biological material can look plastic, especially at small sizes. Observer training and blind checks improve consistency, but appearance alone is weak chemical evidence. Some protocols use visual screening to select candidates and spectroscopy to confirm a subset. The confirmation fraction and selection rule must be reported; otherwise corrected counts can hide which particles were actually tested.
5. Spectroscopy identifies polymers with practical limits
Fourier-transform infrared and Raman spectroscopy compare measured spectra with reference libraries. They can distinguish many polymers and reveal pigments or additives, but particle size, fluorescence, weathering, substrate, instrument settings, and library quality affect matches. Mapping every particle provides stronger coverage but can be slow; subsampling improves throughput while adding sampling uncertainty. A similarity score is not a universal pass threshold. Studies should report acquisition parameters, libraries, match criteria, and manual review procedures.
6. Tiny particles create a metrology frontier
As particle size approaches micrometre and nanometre scales, collection, identification, counting, and mass estimation become harder. Conventional imaging loses chemical certainty, while bulk methods can quantify polymer mass without particle counts or shapes. Nanoplastics may behave differently and require specialized separation and reference materials. Extrapolating a distribution below the method’s detection limit can produce dramatic but model-dependent totals. NIST and other metrology programs develop control materials and validated methods so laboratories can measure the same object more comparably.
7. Contamination control is part of the measurement
Synthetic clothing, laboratory air, tubing, filters, gloves, and packaging can contribute fibres or fragments. Teams use covered glassware, filtered reagents, controlled clothing, cleaned equipment, and procedural blanks. Blank correction is not simply subtracting a number if contamination varies by type and batch. Negative values, detection limits, and excluded samples need predefined rules. Reporting blank particle identities and counts lets readers judge whether the environmental signal is large relative to contamination introduced during the workflow.
8. Health and ecological claims need an exposure bridge
Finding particles in water does not by itself establish dose, biological uptake, hazard, or disease risk. Exposure assessment needs concentration by relevant size and polymer, intake pathways, persistence, and population behavior. Toxicology needs realistic particles, doses, contaminants, and endpoints. Environmental effects depend on species and conditions. Measurement harmonization matters because risk estimates cannot be stronger than occurrence data. Precautionary waste reduction can be sensible while scientists continue to clarify which exposures cause which effects.
Conclusion
Microplastics research begins with an analytical contract: what sizes count, how samples are collected, how particles are recovered, how polymers are confirmed, and how contamination is controlled. Disagreement among studies often reflects different windows rather than careless science. Transparent methods and shared reference materials turn scattered counts into comparable evidence.