Wastewater Surveillance: How a Sewer Sample Becomes a Community Health Signal
Follow the path from a composite sewage sample to a population trend, and learn what wastewater data can and cannot reveal.
This guide explains research and technology. It does not provide diagnosis or treatment, and regulatory status should be checked with the relevant authority.
Reviewed October 10, 2026. This explainer describes population surveillance, not individual medical testing or clinical advice.
Wastewater carries biological material shed by many people in a sewershed. A laboratory can measure fragments of a pathogen in a sample and public-health teams can track how that measurement changes. The result is valuable precisely because it is collective: it can provide a community-level signal without requiring every person to visit a clinic.
That strength is also the source of its limits. Wastewater does not identify which resident is infected, how severe any illness is, or exactly how many cases exist. The signal depends on who contributes to the sewer, how the sample was collected, laboratory methods, flow, weather, and the statistical choices used to compare measurements.
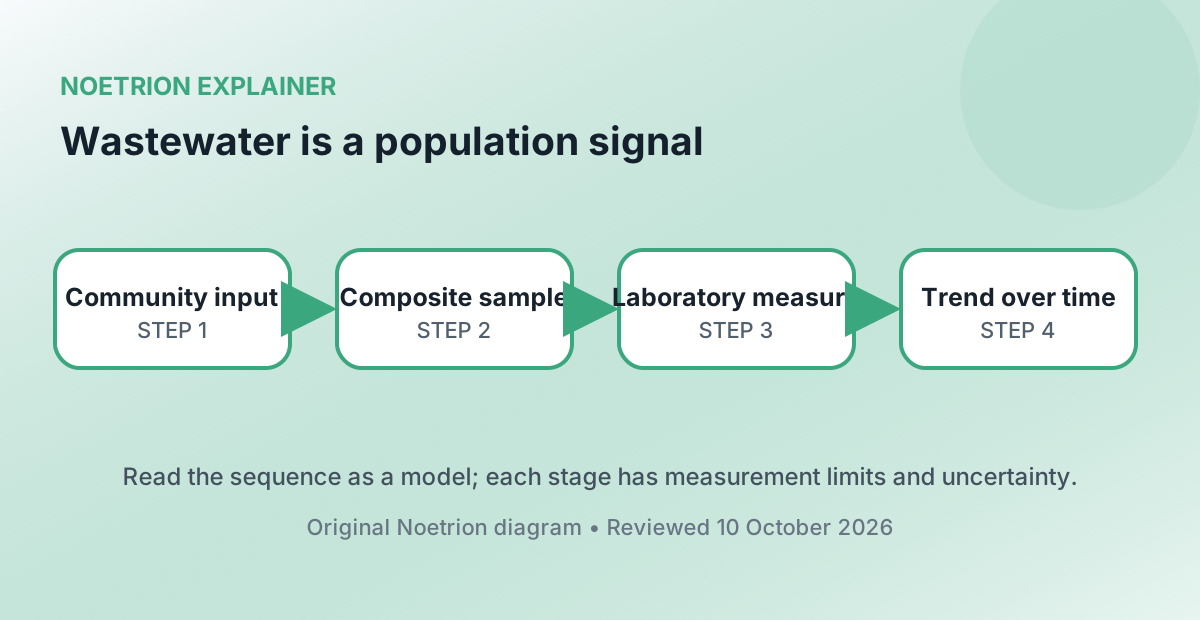
1. Begin with the sewershed, not a city label
A sewershed is the area whose wastewater flows to a sampling point or treatment plant. Its boundary may not match a city, district, or health jurisdiction. People using septic systems may be absent, while commuters, tourists, hospitals, prisons, or universities may contribute disproportionately at some locations.
Before comparing two places, check the estimated population served and the sampling location. A larger catchment often produces a smoother aggregate signal, while a small site can change sharply when only a few contributors change. Neither is automatically better: the proper scale depends on whether the decision concerns a citywide trend or a specific institution.
2. Sampling strategy changes what the bottle represents
A grab sample captures wastewater at one moment. A composite sample combines material collected across a period, commonly by taking many small subsamples. Composite sampling can better represent variation over a day, but equipment, access, cost, and the surveillance question influence the design.
Sampling frequency matters as well. One result per week can miss short movements and makes each observation influential. More frequent sampling provides a denser time series, but only if collection and laboratory procedures remain comparable. Metadata should record the site, dates, sample type, preservation, and important operational events.
| Design choice | What it changes | Question to ask |
|---|---|---|
| Sampling point | Population represented | Who actually contributes here? |
| Grab or composite | Time represented | Is a moment or a period the target? |
| Frequency | Trend resolution | Could sparse sampling hide volatility? |
| Storage and transport | Material integrity | Were temperature and timing controlled? |
3. Laboratories measure genetic targets, not cases
For many surveillance programs, laboratories concentrate a sample, extract nucleic acids, and use a molecular assay such as reverse-transcription quantitative PCR. The assay targets a defined genetic sequence. Quality controls help detect failed extraction, inhibition, contamination, or poor recovery.
The measurement may be reported as concentration, a normalized value, or a modeled index. A pathogen target can be normalized to wastewater flow or to another fecal marker to reduce some variation in dilution and human input. Normalization does not magically remove all noise; it introduces its own measurement uncertainty and assumptions.
Different laboratories can use different targets, protocols, instruments, and reporting units. Trend comparisons are strongest when a site uses a stable method and when method changes are documented. A sudden discontinuity after a laboratory switch may be procedural rather than epidemiological.
4. Trend is usually more defensible than an exact case count
People vary in how much biological material they shed and for how long. Shedding can occur before, during, or after symptoms, and not every contributor has the same wastewater pathway. Rainfall, industrial discharge, travel time, temperature, and sewer maintenance can affect the sample. These variables make a direct conversion from concentration to an exact number of infected people difficult.
Programs therefore often emphasize direction: rising, falling, or stable. Analysts may smooth noisy measurements or compare a recent period with a prior baseline. Every transformation should be documented because smoothing trades responsiveness for stability. A moving average can make a chart readable but can also delay a turning point.
5. Detection and nondetection need careful language
A nondetect does not prove that nobody in the sewershed is infected. The pathogen may be present below the assay's detection capability, the sampled portion may not contain it, or sample quality may be poor. Similarly, a detected fragment does not show that infectious organisms are present or that transmission occurred through wastewater.
Analysts should distinguish the limit of detection from the limit of quantification and explain how values below those thresholds are handled. Replacing every nondetect with zero can distort summaries. Omitting them can distort the series in a different way. The chosen rule belongs in the public documentation.
6. Compare aligned signals, not isolated peaks
Wastewater is most useful alongside other evidence: clinical testing, emergency visits, hospital admissions, outbreak reports, and syndromic surveillance. These indicators observe different parts of a disease process and have different lags. A rise in wastewater may precede some clinical indicators, but the timing is not fixed across pathogens, locations, or periods.
An apparent association is not proof that one measurement caused another. Align dates, reporting delays, geographic coverage, and population definitions before calculating correlations. Avoid searching across many time lags and presenting only the strongest one without disclosing the search.
7. Read a dashboard with five questions
- What sewershed and population does the site represent?
- How often are samples collected, and are recent points complete?
- What is the unit, normalization method, and trend calculation?
- Were laboratory or sampling methods changed?
- Which independent indicators support or contradict the signal?
These questions turn a colorful line into an auditable measurement. Wastewater surveillance is powerful because it can capture a broad community signal with relatively little individual participation. It becomes misleading only when that signal is treated as a precise census of illness or detached from the system that produced it.