Pandas Resampling: Define the Time Bins Before Trusting the Totals
Trace boundary events into explicit time bins, distinguish empty bins from missing readings, and separate event time from feature availability.
Reviewed October 8, 2026. Examples target pandas 2.2.3; all timestamps and readings are synthetic.
An hourly chart seems straightforward until an event occurs exactly at 01:00. Should that event belong to the hour ending at 01:00 or the hour starting there? Both conventions can be legitimate, but they produce different totals. A timestamp attached to the result does not answer the question by itself: the label and the interval's included boundary are separate choices.
Resampling groups datetime-like observations into time bins and applies an operation within each bin. This guide makes the interval contract explicit, checks counts alongside totals, and explains why an hourly aggregate may not have been available at its displayed timestamp. The emphasis is interpretation rather than an unexplained one-line chart recipe.
1. Specify the time axis and the measurement meaning
Start with what the timestamps represent: event occurrence, sensor observation, receipt by a server, or report publication. These times can differ. Parsing a timestamp successfully does not prove which meaning it has. Validate the intended timezone and decide how naive local timestamps, ambiguous daylight-saving times, and late-arriving records are handled.
The examples use UTC so the bin arithmetic is unambiguous. A business report may instead require local calendar days. That is a different contract, particularly where day length varies with daylight-saving transitions. Choose the reporting timezone before grouping; converting labels afterward is not always equivalent to defining bins in that timezone.
Also identify the value's grain. Summing event quantities can be appropriate, but summing cumulative meter readings usually is not. Rates, balances, and snapshots require an aggregation that matches their measurement semantics. Resampling determines membership; it does not determine which arithmetic is meaningful for your column.
2. Distinguish membership from the displayed label
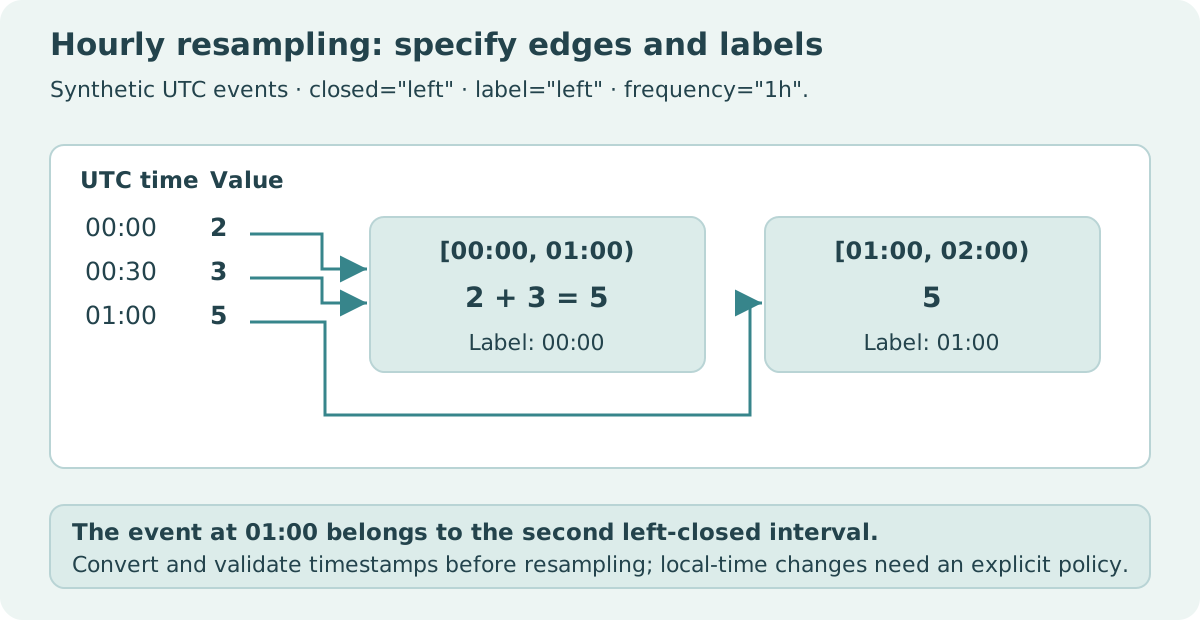
For an hourly left-closed interval, [00:00, 01:00) includes 00:00 and excludes 01:00. Setting label="left" displays 00:00 for that interval; setting label="right" displays 01:00 for the same membership. Changing the label alone does not move the boundary event.
import pandas as pd

index = pd.to_datetime(["2026-01-01 00:00Z", "2026-01-01 00:30Z",
                        "2026-01-01 01:00Z"], utc=True)
readings = pd.Series([2, 3, 5], index=index)
left = readings.resample("1h", closed="left", label="left").sum()
relabeled = readings.resample("1h", closed="left", label="right").sum()
right = readings.resample("1h", closed="right", label="right").sum()
assert left.tolist() == [5, 5]
assert relabeled.tolist() == [5, 5]
assert (relabeled.index == left.index + pd.Timedelta("1h")).all()
assert right.tolist() == [2, 8]
assert left.sum() == right.sum() == readings.sum() == 10
print(pd.DataFrame({"left_closed": left, "right_closed": right}))
The right-closed convention assigns 00:30 and 01:00 to the bin ending at 01:00, giving eight. The event exactly at 00:00 belongs to the preceding interval ending there, giving two. Both policies reconcile to the same overall total in this fixture, while distributing that total differently.
Defaults vary by frequency, so do not generalize an hourly default to every weekly, monthly, or annual offset. State closed and label explicitly for a report whose boundary behavior matters. For fixed tick frequencies, origin and offset can establish the grid alignment. A timezone-aware origin must be compatible with the index's timezone.
3. Keep empty bins separate from all-missing bins
A zero aggregate can mean zero observed quantity, no records, or no valid readings, depending on the aggregation settings. Include row counts and valid-value counts to distinguish those states. sum(min_count=1) requires at least one valid value, but does not prove that every expected reading was supplied.
import pandas as pd

index = pd.to_datetime(["2026-01-01 00:00Z", "2026-01-01 00:30Z",
                        "2026-01-01 01:00Z", "2026-01-01 03:30Z"], utc=True)
readings = pd.Series([2.0, 3.0, 5.0, float("nan")], index=index)
bins = readings.resample("1h", closed="left", label="left")
report = pd.DataFrame({"rows": bins.size(), "valid": bins.count(),
                       "total": bins.sum(min_count=1)})
assert report["rows"].tolist() == [2, 1, 0, 1]
assert report["valid"].tolist() == [2, 1, 0, 0]
assert report["total"].iloc[:2].tolist() == [5.0, 5.0]
assert report["total"].iloc[2:].isna().all()
assert int(report["rows"].sum()) == len(readings)
print(report)
| UTC bin start | Rows | Valid readings | Sum requiring one valid value |
|---|---|---|---|
| 00:00 | 2 | 2 | 5 |
| 01:00 | 1 | 1 | 5 |
| 02:00 | 0 | 0 | Missing: no records |
| 03:00 | 1 | 0 | Missing: supplied reading is absent |
The two missing totals deserve different diagnostic explanations. If the sensor was expected to report every fifteen minutes, even the first bin might be incomplete despite having valid readings. Compare counts with an independently defined expectation when coverage matters. A resampling function cannot infer the sampling schedule from missing data alone.
4. Choose aggregation and weighting deliberately
A mean of observed rows is an observation-weighted mean. If measurements occur more frequently during busy periods, it is not automatically a time-weighted mean over the hour. Establish whether each observation has equal analytical weight, represents a duration, or is a cumulative measurement before selecting an operation.
Similarly, averaging hourly averages gives each hour equal weight, while pooling original observations gives each observation equal weight. Those results agree only under particular conditions. Preserve counts or weights alongside intermediate aggregates so a later stage can recombine them correctly. Do not retain only a rounded average when downstream calculations need its denominator.
Upsampling also does not create new observations. Filling gaps with previous values or interpolation introduces a modeling assumption. A held value may be valid for a state that remains in effect until changed, but unsuitable for independent events or unreliable sensors. Label filled values and retain their distance from real observations when that distinction matters.
5. Event time is not feature availability
A bin labeled 00:00 under the left-label convention may summarize events through just before 01:00. Using that total to predict an outcome at 00:15 would include future events relative to the prediction time. A neat index is not an availability audit.
For prediction, establish when all contributing records could actually be known, including ingestion delays and revisions. A right-edge label can communicate an interval end but still does not guarantee timely arrival. A late event may belong historically to one bin while becoming available only in a later processing run. Preserve event time, availability time, and dataset version when the use case requires them.
Duplicate timestamps also require interpretation. Two valid events at the same time are not necessarily duplicates. Two copies of the same event can double the total. Deduplicate by a defensible event identity rather than by timestamp alone, then reconcile the accepted input with bin membership.
6. Review and test the bin contract
Define the reporting range independently when a report must include time before the first observation or after the last. Resampling the observed input does not by itself establish the application's complete monitoring period. Reindex to a separately specified grid if those intervals belong in the report, and mark their coverage state explicitly. Otherwise a chart may begin late or end early without showing that the expected observations were absent. Empty output ranges need an explicit policy too.
Include events just before, exactly on, and just after a boundary in the test fixture. Check membership separately from labels, then verify totals and row-count reconciliation. Add an empty interval and an interval containing only missing values. These cases reveal more than a smooth chart with regular timestamps.
For practice, set an hourly offset of thirty minutes and predict where the three original events move before running the calculation. Explain whether the new grid matches the reporting question. Record timezone, frequency, origin, offset, boundary convention, aggregation, and missing-value policy together so another reader can reconstruct the same report.
Sources and scope
- pandas 2.2.3: resample parameters.
- pandas 2.2.3: Resampler.sum and min_count.
- pandas 2.2.3: time-series guide.
All totals come from the displayed synthetic inputs. The examples do not establish a real sensor's coverage or data-arrival guarantees.