Poverty Headlines and Household Budgets: Read the Yardstick Before the Number
Decode the World Bank's latest poverty update, distinguish data revisions from real change, and build a household resilience budget using local costs.
Two poverty headlines can sound incompatible and still describe different things correctly. One may use a national basic-needs threshold; another may use an international benchmark. A third may report a revised estimate for the same historical year. Before drawing conclusions about living standards, identify which question each number answers.
That discipline also improves personal budgeting. A global poverty line is a statistical yardstick, not a recommended spending allowance. Your rent, transport, care responsibilities, and income reliability need their own worksheet. Understanding the measurement prevents you from turning a useful public indicator into a misleading private rule.
What changed in the latest global update
The World Bank's September 22, 2026 poverty update estimates that 824.3 million people, or 10.1% of the global population, lived in extreme poverty in 2024. That is the latest year with sufficient data coverage in this release. The 2025 and 2026 figures are nowcasts, with 2026 projected at 9.8%, rather than a complete set of household survey observations for 2026.
The update revised the 2024 estimate downward from the March 2026 vintage by 22.5 million people. That difference is a revision of the estimate for one year; it is not evidence that 22.5 million people escaped poverty between March and September. An October correction on the blog fixed switched regional labels in two tables without changing the other text or estimates.
These details matter because a recent publication date can make old measurement years look current. An accurate chart labels the year being estimated and the version of the dataset used to estimate it.
Keep a data-vintage record
A vintage is a version of a dataset available at a particular time. New surveys, population updates, price data, and improved methods can change historical estimates. This is normal statistical maintenance, but comparisons must respect it.
| Number in a report | What to record | What not to infer |
|---|---|---|
| Estimate for 2024, released September 2026 | Measurement year and release vintage | That it directly measures September 2026 conditions |
| Revision of the 2024 estimate | Old and new values for the same year | That the difference is a six-month economic improvement |
| Nowcast for 2026 | Projection method and input vintage | That every household was observed in 2026 |
| Corrected chart label | Nature of the correction | That the underlying numerical series necessarily changed |
The World Bank's September methodology note documents the update. Read such a note when a headline surprises you. Ask whether the change comes from a new observation, a different benchmark, or a revised statistical input.
When making your own trend chart, use one consistent vintage for all years where possible. Comparing a 2023 estimate from an older release with a 2024 estimate from a newer release can mix real changes with methodological revisions. Save the download date alongside the data file so another reader can reproduce the chart later.
Purchasing power parity is not a currency quote
The current extreme-poverty benchmark is $3.00 per person per day in 2021 purchasing power parity terms. The World Bank's June 2025 explanation sets out the use of PPPs and the additional $4.20 and $8.30 benchmarks associated with lower-middle- and upper-middle-income countries.
An international dollar used for this comparison is not a US dollar you can exchange at today's bank rate. PPPs adjust for price differences between economies. They help compare what resources can buy, while a market exchange rate tells you how currencies trade. Multiplying the poverty line by today's dollar-rupiah quote therefore does not reproduce the official local equivalent.
A fictional illustration makes the distinction clear. Suppose one international dollar corresponds to 6 local units in a PPP calculation, while one traded US dollar costs 15 local units. A 3-international-dollar threshold corresponds to 18 local units before any further time or spatial adjustments. A market conversion would produce 45. The latter answers a currency-exchange question, not the intended living-standard comparison. Neither conversion supplies an actual family's rent budget.
Why Indonesian poverty figures can differ
The September 9, 2026 joint BPS–World Bank statement explains that both institutions use SUSENAS, but their thresholds serve different purposes. It reports Indonesia's national poverty rate at 8.07% in March 2026, and the World Bank's 2025 estimate of 64.1% below its upper-middle-income benchmark.
Those numbers differ in both benchmark and measurement year. Presenting them as rival answers to an identical question hides that distinction. The national measure reflects Indonesia's own basic-needs context and is used for domestic policy and progress. The international benchmark supports cross-country comparison against a common standard.
A higher threshold will generally count more people below it, even if nobody's consumption changed. That does not make deprivation imaginary. It means the boundary being evaluated is different. A family can be above a narrowly defined poverty threshold and still be financially fragile, especially if a single medical expense or interrupted paycheck would remove its remaining buffer.
Build a local essential-cost budget
Use your own local prices for a household worksheet. The following example is fictional and uses millions of rupiah per month. It is not an official poverty assessment, a recommended income, or an estimate of typical Indonesian expenses.
| Monthly item | Fictional amount, Rp million | Treatment |
|---|---|---|
| Housing | 1.20 | Essential cash outflow |
| Food | 1.50 | Essential cash outflow |
| Transport | 0.45 | Essential cash outflow |
| Utilities and connectivity | 0.35 | Essential cash outflow |
| Health and care | 0.25 | Essential cash outflow |
| Minimum debt payments | 0.30 | Contractual cash obligation |
| Total essential and contractual outflows | 4.05 | Sum of the six items |
| Irregular-expense reserve | 0.25 | Monthly allocation, not today's bill |
| Reliable net income | 4.80 | Excludes uncertain extra work |
| Unallocated monthly margin | 0.50 | 4.80 − 4.05 − 0.25 |
The reserve can cover predictable but infrequent costs such as repairs or school-related purchases. Separating it from ordinary monthly bills prevents a quiet month from looking more affordable than the year really is. Keep a second record for the actual payment dates; allocating money to a reserve is different from spending it.
Do not average uncertain income into “reliable income” without explaining it. If extra work arrives irregularly, record its range and timing separately. Also distinguish net income from gross revenue: business expenses, fees, and tax obligations can make them substantially different.
Test fragility without declaring a universal rule
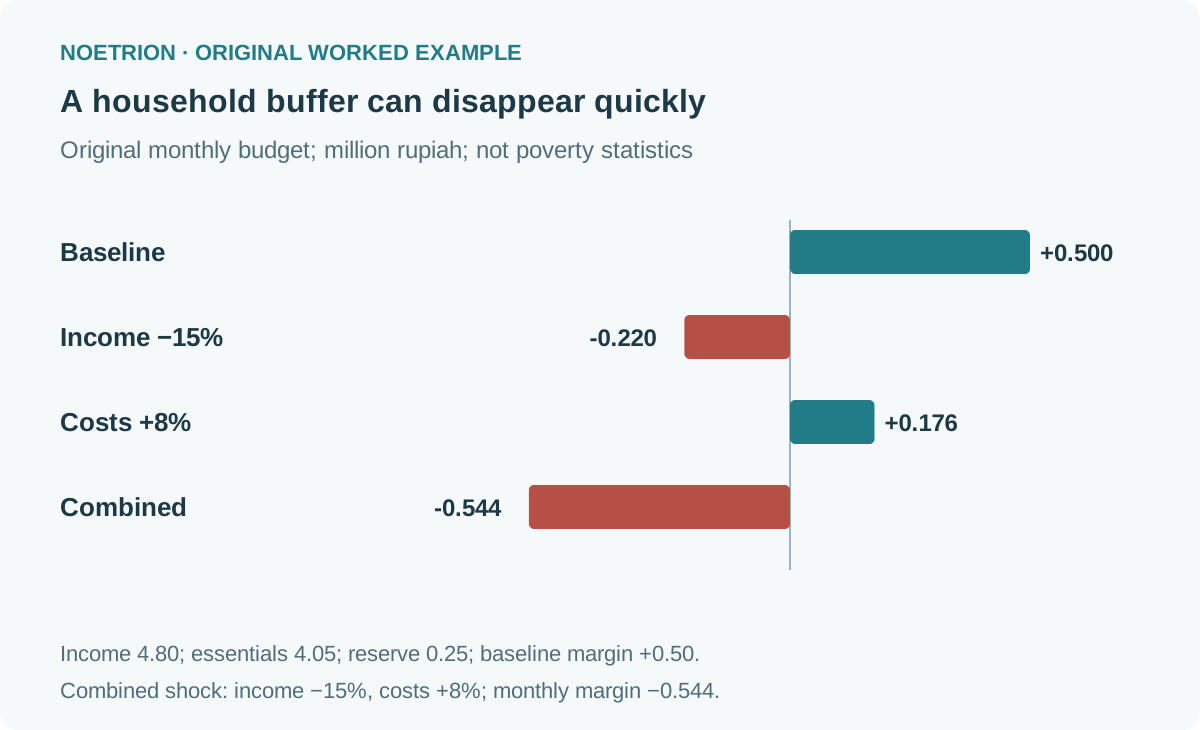
For the same fictional household, a 15% fall in reliable income reduces it from Rp4.80 million to Rp4.08 million. If essential and contractual costs stay at Rp4.05 million and the Rp0.25 million reserve continues, the monthly margin becomes negative Rp0.22 million.
A different test increases essential and contractual costs by 8% while holding income constant. Costs become Rp4.374 million, leaving Rp0.176 million after the reserve. With both changes together, the monthly shortfall becomes Rp0.544 million.
Suppose accessible cash is Rp1.80 million. In a complete income interruption, dividing it by Rp4.05 million of essential and contractual monthly outflows gives roughly 0.44 months of coverage. That calculation excludes the reserve allocation and assumes those expenses cannot be reduced. It is a liquidity indicator, not a claim that every household needs an identical emergency-fund target.
Make the worksheet useful for decisions
The worksheet should expose constraints, not judge the person using it. Some outflows are technically adjustable but carry serious costs: cutting transport may jeopardize work; cutting connectivity may disrupt study; delaying care may create a larger problem. Label each item by what happens if it is reduced.
| Decision question | Evidence to gather | Possible next action |
|---|---|---|
| Is the problem timing or total income? | Pay dates and bill dates | Discuss payment schedules before adding borrowing |
| Which cost can change safely? | Actual usage and cancellation conditions | Compare a feasible lower-cost option |
| Is extra work worthwhile? | Net pay after travel, time, and other expenses | Calculate the net gain before accepting |
| Is support available? | Current official eligibility criteria | Check the responsible local institution |
| How much cash is accessible? | Withdrawal restrictions and settlement time | Separate liquid cash from illiquid assets |
Run the worksheet with receipts and statements where available. Avoid false precision when costs vary: use a range for food or transport and note why. Review the numbers when household membership, employment, housing, or care needs change—not only when a new poverty headline appears.
If spending cannot be reduced without sacrificing essentials, better budgeting alone will not close an income gap. The relevant options may involve support, renegotiation, income opportunities, or debt assistance. A clear worksheet helps explain the gap, but it cannot manufacture resources.
Read the next headline with four questions
Before sharing a poverty statistic, identify the benchmark, the year, the vintage, and whether the figure is observed, estimated, or nowcast. Add the source link so a reader can inspect those details. If two figures differ, first test definitions before assuming one institution is wrong.
For personal planning, then switch tools. Use local costs and accessible resources rather than an international poverty line. Public indicators reveal patterns across populations; your household worksheet reveals the particular commitments and shocks you can act on. Both are useful when their roles remain clear.
The CPI and cost-of-living explainer shows why a household basket can differ from an aggregate index.
Sources and verification notes
- World Bank September 22, 2026 global poverty update, including its October correction note.
- September 2026 PIP methodology note.
- June 2025 explanation of global poverty lines.
- September 9, 2026 joint BPS–World Bank statement.
Sources checked October 14, 2026. Household values and conversion factors are synthetic, and their arithmetic was independently checked. They do not classify an actual household as poor or establish eligibility for a benefit.