Real Wages Can Be Growing While Purchasing Power Is Still Catching Up
Calculate real wage changes without confusing a recent gain with full recovery. Use a worked pay-and-price index, catch-up calculation and earnings checklist.
A pay rise arrives, inflation slows, and the household budget still feels tighter than it did a few years ago. Those observations can coexist. A recent improvement describes a change from the previous period; recovery describes the distance from an earlier reference point.
The distinction remains relevant in the 2026 wage debate. In its 14 October release for September, the US Bureau of Labor Statistics reported that seasonally adjusted real average hourly earnings fell 0.5% over the month. Average hourly earnings rose 0.1%, while the corresponding consumer price index rose 0.6%. These are US aggregate estimates, not an assessment of every worker's pay or an Indonesian household's purchasing power.
For a different period and population, the OECD Employment Outlook 2026 describes positive annual real wage growth in virtually all countries examined in early 2026, while levels remained below early 2021 in about one third. A growing series can still be below its earlier level. The original worksheet below shows exactly how.
Define what your wage buys
A nominal wage is the amount expressed in current currency. A real wage adjusts that amount using a price index. For a comparison across two dates, the exact proportional change is new wage / old wage, divided by new price index / old price index, minus one.
The BLS technical note on real earnings describes this deflation of current-dollar earnings. It also distinguishes hourly earnings from weekly earnings and uses different consumer-price series for the employee groups it reports. A comparison must keep the selected wage series, price measure and population aligned.
For your own worksheet, choose one pay definition and keep it consistent. A gross hourly wage, take-home monthly pay and total compensation are different quantities. Changing the definition halfway through the exercise can create a misleading improvement.
Calculate the first loss without subtracting rates mechanically
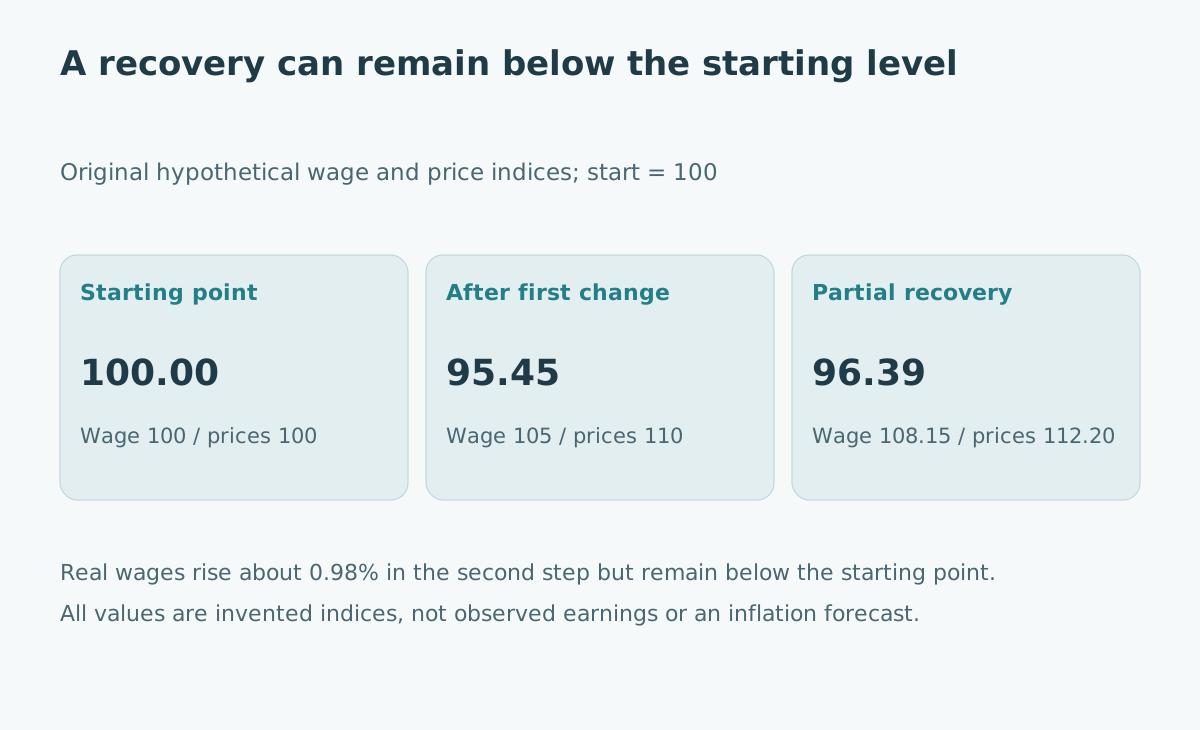
Set a fictional starting wage index and price index to 100. In the next period, pay rises 5% and prices rise 10%. The new indices are 105 and 110. Relative purchasing power becomes 105 / 110 × 100 = 95.4545….
The loss is approximately 4.55%, rather than exactly 5%. Subtracting 10 from 5 is a convenient approximation for small changes, but the exact calculation divides the growth factors. The denominator matters because the same pay is being compared with a changed price level.
| Hypothetical point | Nominal wage index | Price index | Real wage index, start = 100 |
|---|---|---|---|
| Starting point | 100.00 | 100.00 | 100.00 |
| After pay +5%, prices +10% | 105.00 | 110.00 | 95.45 |
| Then pay +3%, prices +2% | 108.15 | 112.20 | 96.39 |
All three columns are indices. The final column expresses purchasing power relative to the chosen start; it is not a salary amount or the percentage of income left after expenses.
A positive change does not close the whole gap
In the second step, the exact real wage growth factor is 1.03 / 1.02. That is approximately 0.98% growth. Purchasing power improves from 95.45 to 96.39, but remains about 3.61% below the starting point.
Both statements are useful: “real wages rose in the latest period” and “real wages have not returned to the starting level.” They answer different questions. A chart that begins at the trough can emphasize the recovery while leaving the earlier loss outside the frame.
Before accepting a claim about recovery, ask for the reference date and the cumulative index. Do not select the comparison date solely because it makes one narrative look convincing. Where possible, show a longer series and explain why the chosen baseline matters.
Work out what catching up would require
At the final hypothetical price index of 112.20, restoring the original purchasing power would require a nominal wage index of 112.20. Starting from 108.15, that requires an additional increase of approximately 3.74%, if prices remain unchanged.
This catch-up percentage differs from the 3.61% shortfall because the denominators differ. The shortfall is measured against the original real wage level; the required increase is measured against the current lower level.
If prices instead rise another assumed 2% before the next pay adjustment, the price index becomes 114.444. Restoring the original purchasing power then requires pay to reach that same index, an increase of approximately 5.82% from 108.15. These are conditional calculations, not recommended salary demands or predictions about inflation.
Keep weekly income and hours in view
A worker's hourly purchasing power can rise while weekly purchasing power falls if paid hours fall enough. In an original example, a 2% increase in real hourly pay combined with a 5% decrease in hours produces a weekly factor of 1.02 × 0.95 = 0.969: a 3.1% decline.
For a household decision, record pay rate, paid hours and employment continuity separately. A higher rate for fewer hours may have advantages, such as more available time, but the change should not be described as a larger weekly income unless the numbers support it.
Likewise, do not infer an individual raise from an aggregate average. The workforce represented by an average can change. Use a consistent personal pay record when evaluating your own change, while using official statistics to understand the broader context.
Use the price index as a benchmark with a defined scope
The BLS consumer-price FAQ explains that CPI measures average price movements for a population and does not match every household's experience. A person facing a large rent increase can experience different budget pressure from someone whose housing costs remain stable.
That does not make the official index useless. It means the aggregate comparison and the household budget are separate pieces of evidence. Keep both visible instead of replacing the official measure with an unexplained personal impression.
For spending decisions, compare recurring take-home income with essential expenses, debt payments and a reasonable buffer. Do not use a real wage index alone to infer disposable income: taxes, transfers, benefits and household composition also matter. The CPI and cost-of-living guide explains the price-measure boundary in more detail.
Build a wage-news reading checklist
| Question | Record before interpreting the claim |
|---|---|
| Which workers? | Geography, employee group and wage definition |
| Which period? | Monthly, annual or cumulative change from a stated baseline |
| Which price measure? | Index, adjustment convention and matching dates |
| Which income unit? | Hourly, weekly or another period, with hours shown |
| Which recovery claim? | Latest direction and distance from the reference level |
Keep the publication date separate from the observation date. The October BLS release cited here concerns September earnings; the OECD discussion cited here concerns early 2026. Neither should be relabeled as a measurement of today's entire labor market.
The most useful conclusion is specific: purchasing power increased over a defined interval, decreased over another, or remains a stated distance from a chosen benchmark. That precision makes a wage headline easier to use in a budget, a compensation review or a discussion of living standards.
Sources and scope
- BLS, Real Earnings—September 2026, released 14 October 2026; all-employee monthly results and observation period checked.
- BLS, Real Earnings technical note, methodology checked 30 October 2026; a rolling page, used for definitions rather than a new estimate.
- OECD Employment Outlook 2026, employment and wages chapter, 2026 report; section 1.2.1 and figure 1.11 discussion reviewed for early-2026 growth-versus-level context.
- BLS, CPI frequently asked questions, scope and household-comparison limitations checked 30 October 2026.
All indexed wage paths, catch-up calculations and weekly-income examples are original teaching scenarios. They do not estimate a particular worker's experience or prescribe a financial decision.