Two Internet Providers Can Share One Failure: Audit the Physical Routes
Evaluate internet backup links with a shared-failure model, physical route questions, and an outage drill instead of assuming two providers mean independence.
A business pays two internet providers and installs automatic failover. Then both connections disappear during the same incident. The equipment may have worked exactly as configured; the problem could be that both services depended on the same piece of infrastructure.
Different invoices do not establish different routes. Providers can share a building entrance, duct, exchange, landing station, or upstream cable. The practical resilience question is which failures the second service actually protects against.
The International Telecommunication Union's 2026 submarine cable work makes geographic diversity and repair readiness timely subjects for network planning. This article turns those ideas into a small, original common-cause calculation and a procurement worksheet. The numbers are teaching assumptions, not estimates of a particular provider's reliability.
The 2026 development: resilience includes geography and repair
On July 10, 2026, the ITU announced approval of a submarine cable resilience report. It identifies physical exposure, repair delays, geographic concentration, and dependence on a small number of systems as challenges. Its recommendations cover deployment and repair, risk identification, and geographic diversity.
The Porto Declaration, affirmed February 3, 2026, is nonbinding. It encourages varied routes, redundant landing points, stronger infrastructure, and clearer processes that support timely deployment and repair.
These are international policy recommendations, not a guarantee that a second business connection has an independent path. They provide a useful reason to ask harder questions about the infrastructure underneath a service contract.
Trace the service chain before counting links
A typical business service can depend on several layers: local power, the router, building access, the provider's local network, upstream transport, international connectivity, and the remote application's own infrastructure. A second access link may protect one layer while sharing another.
Map dependencies as named items rather than broad labels. Two links entering through separate doors might still meet in the same street duct. Two international cables might terminate at the same landing station. Conversely, a service may use multiple protected routes even though the customer sees one provider name.
The useful question is not whether every dependency differs. It is whether the remaining shared dependencies are understood and acceptable for the service being protected. A small office checking email and a platform processing time-sensitive transactions can rationally choose different levels of redundancy.
| Dependency | What to ask | Evidence that improves the answer |
|---|---|---|
| Building entry | Do links share the same entrance or riser? | Survey or provider confirmation |
| Local access | Do they share ducts, poles, or aggregation sites? | Route diversity statement |
| International path | Are landing points or cable systems shared? | Bounded upstream diversity disclosure |
| Power | Does one local supply failure disable both? | Power design and tested runtime |
| Operations | Can one configuration error affect both? | Separate change controls and recovery plan |
Why multiplying outage percentages can fail
If two links fail independently, their simultaneous-failure probability is the product of their individual probabilities. Independence is the important condition, not a mathematical convenience.
Suppose each link has a 0.5% probability of being unavailable at a randomly selected instant, and the failures are independent. The probability that both are unavailable is 0.005×0.005=0.000025, or 0.0025%. In a stationary teaching model, multiplying by 8,760 hours gives 0.219 hours of expected annual simultaneous unavailability, about 13.14 minutes.
This does not predict the number of incidents or their duration distribution. The same expected total could result from rare long outages or more frequent short ones. It also excludes failover interruptions and dependencies beyond the two links.
Most importantly, if a shared cause can disable both, multiplying independent probabilities omits the very event the backup is supposed to survive. A precise decimal cannot compensate for a missing mechanism.
Worked example: add one common cause
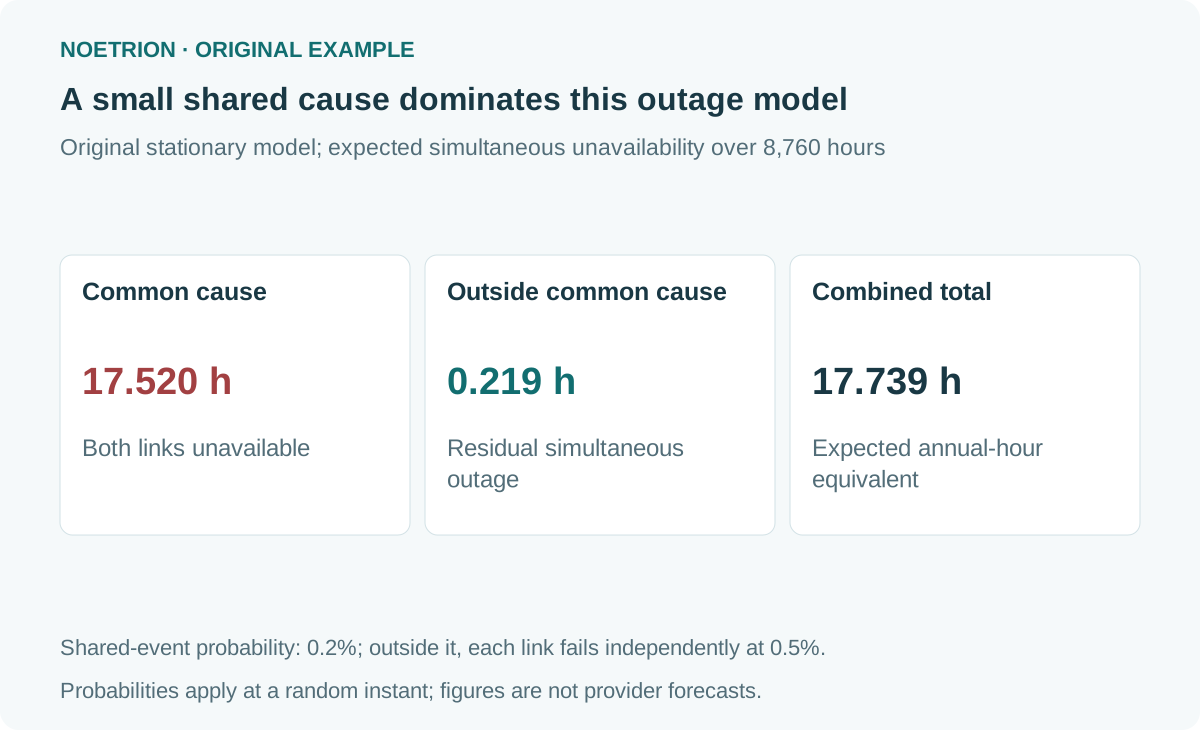
Define a second model with a common-cause event C. At a randomly selected instant, its probability is 0.2%, or 0.002. When C occurs, both links are unavailable. When C does not occur, each link has conditional outage probability 0.5%, independently of the other.
The probability that both are unavailable is therefore:
P(both down)=P(C)+P(not C)×P(A down|not C)×P(B down|not C).
Substituting the synthetic assumptions gives 0.002+0.998×0.005×0.005=0.00202495, or 0.202495%. That corresponds to approximately 17.7386 expected hours per year in this stationary model.
| Model component | Probability at a random instant | Annual-hour equivalent |
|---|---|---|
| Independent simultaneous failures, no common cause | 0.0025% | 0.219 h |
| Common cause in the second model | 0.2% | 17.520 h |
| Residual simultaneous failures outside common cause | 0.002495% | 0.218562 h |
| Total simultaneous unavailability in second model | 0.202495% | 17.738562 h |
The first and second models do not have identical marginal link reliability: adding a shared event increases each link's outage probability too. The comparison illustrates the consequence of an omitted shared mechanism; it is not a controlled estimate of the benefit of buying a particular backup route.
Even the observed link averages cannot establish independence
In the second model, each link's overall outage probability is 0.002+0.998×0.005=0.00699, or 0.699%. If someone multiplies those marginal probabilities as though the links were independent, they get 0.0000488601, implying only about 0.428 hours of simultaneous outage per year.
The actual simultaneous probability in the defined model remains 0.00202495. Both individual averages can be correct while the independence assumption is badly wrong. That is why a provider comparison needs joint incident information and dependency knowledge, not just two uptime percentages.
The same reasoning appears in scenario-based decision making: list mechanisms that can affect multiple options together. The point is to improve the model structure before refining a cost estimate.
Do not interpret the synthetic probabilities as measured submarine cable failure rates. A practical analysis needs a defined service boundary, relevant operating history, restoration information, and explicit treatment of shared events.
Backup capacity matters after the switch
A backup that remains connected may still be too small for normal demand. Define the minimum service that must continue, then check bandwidth, latency, packet loss, and application behavior under that reduced mode.
For example, a fictional office normally uses 300 Mbps but has a 50 Mbps backup. If essential workloads need 35 Mbps during a disruption, the raw capacity margin is 15 Mbps. That says nothing yet about bursts, contention, upstream asymmetry, or whether the applications behave adequately at the changed latency.
Prioritize the actual business functions: authentication, transactions, communication, and recovery access. Bulk downloads or background synchronization may be deferrable. A backup policy should define what is reduced, who activates that mode, and how users know what to expect.
This is different from the infrastructure diversity question. A route can be independent but insufficient, or fast but exposed to the same shared failure. Evaluate both dimensions rather than blending them into one resilience score.
Run an application-level failover drill
A test should observe the service people use, not only a router's link indicator. Coordinate the drill, preserve access for recovery, and avoid disrupting critical operations outside an approved test window.
| Test observation | Why it matters |
|---|---|
| Detection and switching time | A link may fail before the policy reacts |
| Existing sessions | Connections may reset after the public address changes |
| Name resolution and authentication | Network reachability does not guarantee application access |
| Essential workload performance | Backup capacity must serve the chosen minimum |
| Return to normal routing | Restoration can cause another interruption |
| Evidence and ownership | Results should lead to an accountable improvement |
Twelve fictional failovers lasting 45 seconds each would add 540 seconds, or 0.15 hours, of interruption in a year if the windows do not overlap other counted downtime. It is a separate illustrative budget item, not something already included in the earlier probability model.
The DNS, HTTPS, and CDN explainer helps identify why a working transport path can still leave a web application unavailable. Keep those dependencies inside the drill's stated boundary.
Make the procurement requirement testable
Instead of asking for a vague promise of full redundancy, specify which shared risks matter and what evidence is acceptable. Request a route diversity statement, the scope of upstream dependencies disclosed, the notification process for route changes, and the support path during a regional event.
Some exact infrastructure information may be commercially or operationally sensitive. A bounded attestation or independent assessment can still be more useful than an unqualified marketing statement. Record what remains unknown and avoid translating absence of disclosure into assumed independence.
A second provider is an option for resilience, not proof of it. The defensible decision combines physical diversity, sufficient degraded-mode capacity, and a tested recovery path. The invoice count is the beginning of that analysis.
Sources and scope
- ITU, report approval announcement, July 10,2026; announcement reviewed, not the entire working-group report.
- Porto Declaration on Submarine Cable Resilience, February 3,2026; nonbinding international recommendations.
Reviewed October 21, 2026. All probabilities, hours, bandwidths, and failover counts are synthetic. No availability forecast or recommendation about a named network provider is implied.