Water Leak Sensors: Calculate the Value of Saved Water Before Buying the Dashboard
Evaluate water leak sensors with a water balance, repair-time model, and realistic cash savings instead of treating every lost cubic metre as retail revenue.
A leak detection dashboard can locate a problem more quickly. It cannot replace a pipe, verify a meter, collect a bill, or decide whether a repaired leak reduces production or frees water for another customer. Those details determine whether the project improves service and pays for itself.
Water utilities face a compelling reason to get this right. In an April 15, 2026 report on a Southern African workshop, the World Bank linked operational efficiency with utility financial credibility. Participants were planning improvements in non-revenue water, or NRW. The useful lesson for a technology buyer is to join the engineering calculation to the financial calculation before procurement.
This article develops an original, deliberately small district example. The numbers are fictional, but the distinction between recovered water, avoided costs, and collected revenue is essential to a defensible business case.
What the latest utility discussion actually showed
The World Bank account describes a March 2–5, 2026 workshop in Pretoria involving more than 70 representatives from 18 service providers across five Southern African countries. It says participating utilities reported NRW above 45%, and five developed plans for an interim 35% target.
The account estimates potential annual water savings of 31 million cubic metres and financial savings of US$57 million for those five utilities. These are plans and estimates described by the workshop, not audited outcomes achieved by October 2026. Nor do their reported NRW levels establish a global average or a benchmark for an Indonesian utility.
The practical takeaway is the link between technical losses and financing. A bankable project needs a credible baseline, an intervention that changes it, and a way to show where the resulting financial benefit appears.
Start with the water balance, not the sensor count
For this article's simplified accounting, NRW is system input volume minus billed authorized consumption. It can include real physical losses, apparent losses such as measurement or accounting errors, and authorized consumption that is not billed. It is therefore broader than leaks alone.
The World Bank's NRW toolkit includes a water balance tool, financial model, component analysis, and trend analysis. That order matters. A listening sensor addresses some physical leakage mechanisms. It will not, by itself, fix an inaccurate customer meter or an unbilled account.
Consider a fictional district with 1,000 cubic metres entering each day:
| Water balance component | Volume, m³/day | Interpretation |
|---|---|---|
| Billed authorized consumption | 650 | Water recorded for billing |
| Unbilled authorized consumption | 30 | Legitimate use without billing |
| Apparent losses | 70 | Measurement or accounting shortfall |
| Real losses | 250 | Physical leakage in this example |
| Total input | 1,000 | Sum of the four categories |
Its NRW is 350 m³/day, or 35%. A leak project should not claim the entire 350 m³/day as recoverable leakage. Even the 250 m³/day real-loss estimate requires supporting measurement and uncertainty ranges.
Sensors shorten discovery; crews shorten leakage duration
A useful intervention model divides the leak lifecycle into awareness, location, scheduling, repair, and confirmation. Sensors can reduce the time before a suspected leak becomes visible. Field investigation narrows the location. Crews, materials, permits, and access determine when flow actually stops.
In a hypothetical recurring leak category, assume average flow is 20 m³/day. Before the intervention, each leak lasts 30 days from onset to completed repair. Afterward, faster awareness and a workable repair process reduce duration to 10 days. The difference is 20 days, or 400 m³ per leak.
At 24 similar leaks per year, that category avoids 9,600 m³ annually. This is an engineering estimate under stated assumptions, not a claim that every alarm corresponds to a leak or that every leak has identical flow. If repair duration remains 30 days because no crew is available, faster detection may produce better information without the forecast water savings.
One reason to pilot the system is to measure those intermediate steps. Record first alert, confirmation, work order, repair completion, and the post-repair flow check. A vendor accuracy percentage tells you less about service improvement than this complete chain.
The business case: recovered water has two destinations
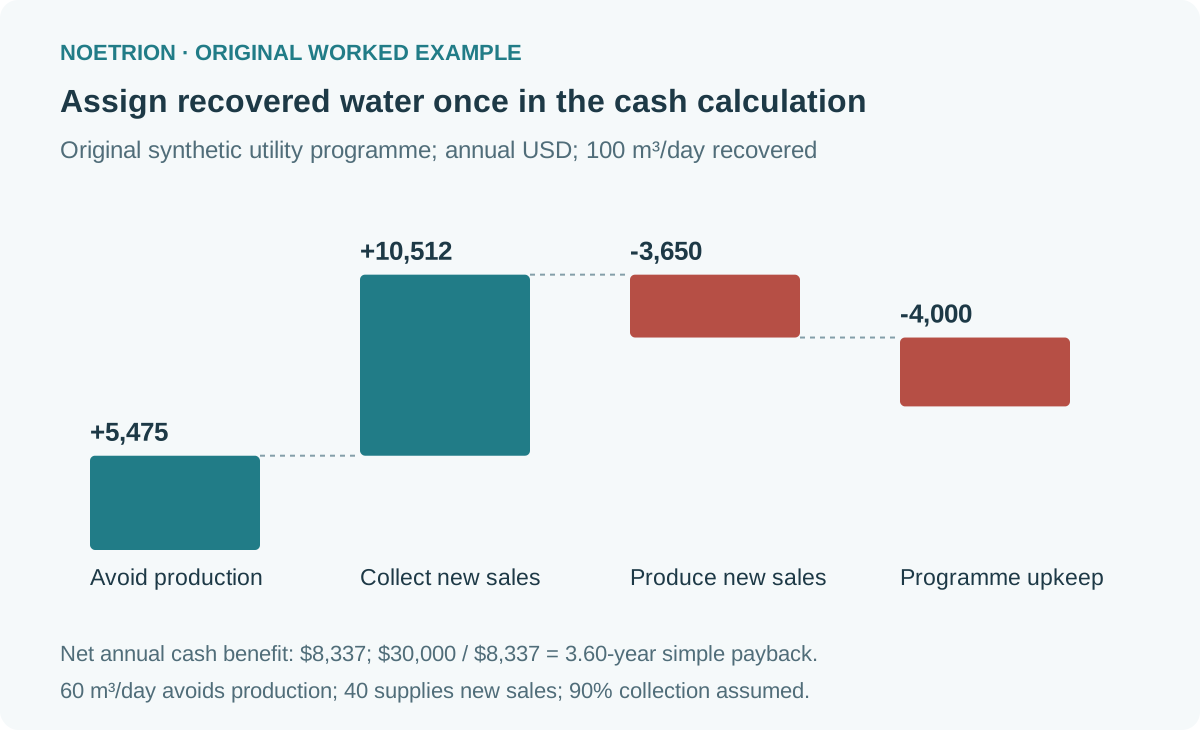
Use a separate larger scenario for the district's overall programme: verified repairs recover 100 m³/day for 365 days, or 36,500 m³/year. The utility can reduce production by 60 m³/day. It uses the remaining 40 m³/day to supply additional billed demand. The allocation is explicit, so benefits are not counted twice.
Assume avoided variable treatment and pumping cost is $0.25 per cubic metre. This is a fictional marginal cost, not the average total cost of running the utility. Assume newly sold water is billed at $0.80/m³, has the same $0.25/m³ variable production cost, and 90% of billed amounts are collected.
| Benefit calculation | Annual amount |
|---|---|
| Avoided production: 60 × 365 × $0.25 | $5,475 |
| Collected new sales: 40 × 365 × $0.80 × 90% | $10,512 |
| Variable cost of those new sales: 40 × 365 × $0.25 | −$3,650 |
| Combined annual operating benefit | $12,337 |
| Programme operation and maintenance | −$4,000 |
| Net annual cash benefit before financing and tax | $8,337 |
With $30,000 initial investment, simple payback is $30,000 / $8,337, approximately 3.60 years. The estimate excludes discounting, replacements, tax, financing, and wider service benefits. It is a screening calculation, rather than a full investment appraisal.
A retail-price shortcut overstates the opportunity
Multiplying all 36,500 recovered cubic metres by $0.80 gives $29,200. That tempting headline assumes all recovered water becomes additional billed sales, all bills are collected, and selling it incurs no variable cost. None of those assumptions matches the example.
If there is no unmet demand and the utility can only reduce production, the annual benefit is 36,500 × $0.25 = $9,125 before programme costs. After $4,000 maintenance, it is $5,125, producing a simple payback of approximately 5.85 years. The same repaired volume supports a different cash case because its destination changes.
Conversely, a constrained utility may value recovered water for more reliable service, fewer interruptions, or deferring a new supply investment. Those benefits can be significant, but they should be documented separately. Avoid inventing a cash saving for an investment that is merely postponed unless the timing and decision really change.
Set an acceptance test that survives seasonal changes
A district flow reduction immediately after repair is useful evidence, but demand, pressure, supply hours, and meter accuracy also affect comparisons. A buyer should define the baseline and adjustment procedure before the pilot starts, then preserve raw observations.
| Acceptance question | Evidence to retain |
|---|---|
| Did alerts identify actionable leaks? | Confirmed leaks, unconfirmed alerts, and investigation time |
| Did repair become faster? | Time stamps for detection, location, scheduling, and completion |
| Did physical flow fall? | Comparable pre/post observations and meter checks |
| Did service stay adequate? | Pressure and continuity checks at relevant locations |
| Did money improve? | Production costs, additional bills, collections, and programme spending |
| Will performance persist? | Battery, communications, calibration, and crew maintenance plan |
Minimum night flow can be a useful diagnostic, but nighttime legitimate demand must be considered. A lower reading is not automatically a recovered leak. The same caution applies to percentage NRW: changes in the denominator can move the percentage without an equivalent change in leakage volume.
What to ask before committing capital
An operational team should know who owns each alert and how many investigations it can handle. A finance team should know whether the forecast benefit reduces a cash expense or increases a cash receipt. Procurement should know how performance will be measured when the initial sensor batteries age or communications fail.
Ask suppliers for a bounded pilot, exportable data, a repair workflow, and costs across the expected useful life. Define what happens if an alert cannot be confirmed. An opaque score without accessible observations makes later evaluation unnecessarily difficult.
For a public service, the decision also includes priorities that a narrow payback cannot settle: reliable supply, equitable access, asset condition, and resilience. State those objectives openly. The strongest case combines measured physical improvement with realistic cash effects, then explains the service value that sits outside the cash calculation.
A dashboard becomes worthwhile when its information changes an action that matters. In water infrastructure, that action ends with a verified repair and a better service, not with a brightly coloured alert.
The predictive maintenance cost worksheet extends the same alert-to-intervention distinction to equipment.
Sources and scope
- World Bank, Water utility creditworthiness: Reduce leaks, secure future, April 15, 2026; describes workshop plans and estimates.
- World Bank PPP Resource Center, NRW tools and resources, reviewed October 14, 2026.
- World Bank, Digital Water, context on digital utility operations and leak workflows.
All district volumes, prices, project costs, and results calculated here are synthetic. They are not a quotation for a particular utility, country, or sensor vendor.