Profitable but Short of Cash: Work the Cash Conversion Cycle Before Changing Invoice Terms
Calculate inventory, receivable, and payable days, then trace a profitable order's cash gap and compare invoice-term changes with an explicit timeline.
A profitable order can make next month's payroll harder to fund. The customer may owe more than the order cost, yet the supplier and employees need payment before the customer sends cash. The cash conversion cycle helps describe that timing gap. A dated cash forecast tells you how large the gap becomes.
An average in days reveals an operating pattern; a dated cash forecast reveals whether obligations can be met. The synthetic examples below separate those jobs.
Profit records an outcome; cash records a deadline
Imagine buying goods for $60,000 and selling them for $90,000, with $12,000 of associated operating costs. Ignoring tax, interest, and other expenses, the order produces $18,000 profit. None of that arithmetic says when the $90,000 arrives.
ACCA's working capital explanation distinguishes profitability from the ability to meet short-term obligations. Extending customer credit can increase sales while worsening the cash position. That distinction is especially useful when a manager asks why a growing sales book has not increased the bank balance.
An unpaid invoice requires collection or financing to fund a payment. Inventory value does not guarantee a buyer next Tuesday. A current ratio can describe asset coverage while leaving the payment timetable unresolved.
Calculate the cycle with matching balances and flows
The standard relationship is cash conversion cycle = inventory days + receivable days − payable days. BDC's cash conversion guide gives formulas using average balances; ACCA discusses the purchase-cost approximation behind payables days.
For a 365-day observation period, use these definitions consistently:
| Metric | Formula | Matching decision |
|---|---|---|
| Inventory days, DIO | Average inventory ÷ annual cost of goods sold × 365 | Measure inventory at cost, not selling price |
| Receivable days, DSO | Average trade receivables ÷ annual net credit sales × 365 | Separate cash sales where possible |
| Payable days, DPO | Average trade payables ÷ annual credit purchases × 365 | Use purchase flows matching the payables population |
| Cash conversion cycle, CCC | DIO + DSO − DPO | Use the same reporting period and business scope |
Cost of goods sold is sometimes used as a proxy for credit purchases when appropriate data is unavailable. Mark that approximation. A manufacturer buying raw materials while selling goods made last year can have purchases quite different from cost of goods sold. Mixed cash and credit purchasing creates another mismatch.
Beginning and ending balances provide a simple average. Monthly or daily balances may describe a seasonal business better. For a quarter, divide by the quarter's matching flows and multiply by the days in that quarter; do not mix one quarter of sales with a 365-day multiplier.
Work an annual calculation before interpreting it
Assume a synthetic company reports annual credit sales of $1,095,000, cost of goods sold of $730,000, and credit purchases of $730,000. Average inventory is $90,000, receivables $90,000, and trade payables $60,000. All figures cover the same 365-day period.
| Component | Daily flow | Average balance | Days |
|---|---|---|---|
| Inventory | $2,000 cost of goods sold | $90,000 | 45 |
| Receivables | $3,000 credit sales | $90,000 | 30 |
| Payables | $2,000 credit purchases | $60,000 | 30 |
| Cycle | 45 + 30 − 30 | — | 45 |
The company takes an estimated 45 days between supplier payment and customer collection across its operating cycle. Its inventory-plus-receivables-minus-payables investment is $120,000. That figure differs from total working capital, which includes other current assets and liabilities.
Do not multiply the 45-day CCC by sales per day and call the result an exact funding requirement. Inventory and payables are cost-based while receivables include the selling margin. In this example that shortcut gives $135,000, different from the measured $120,000 operating investment. Payroll, taxes, deposits, and borrowing add further differences.
Trace one profitable order through actual dates
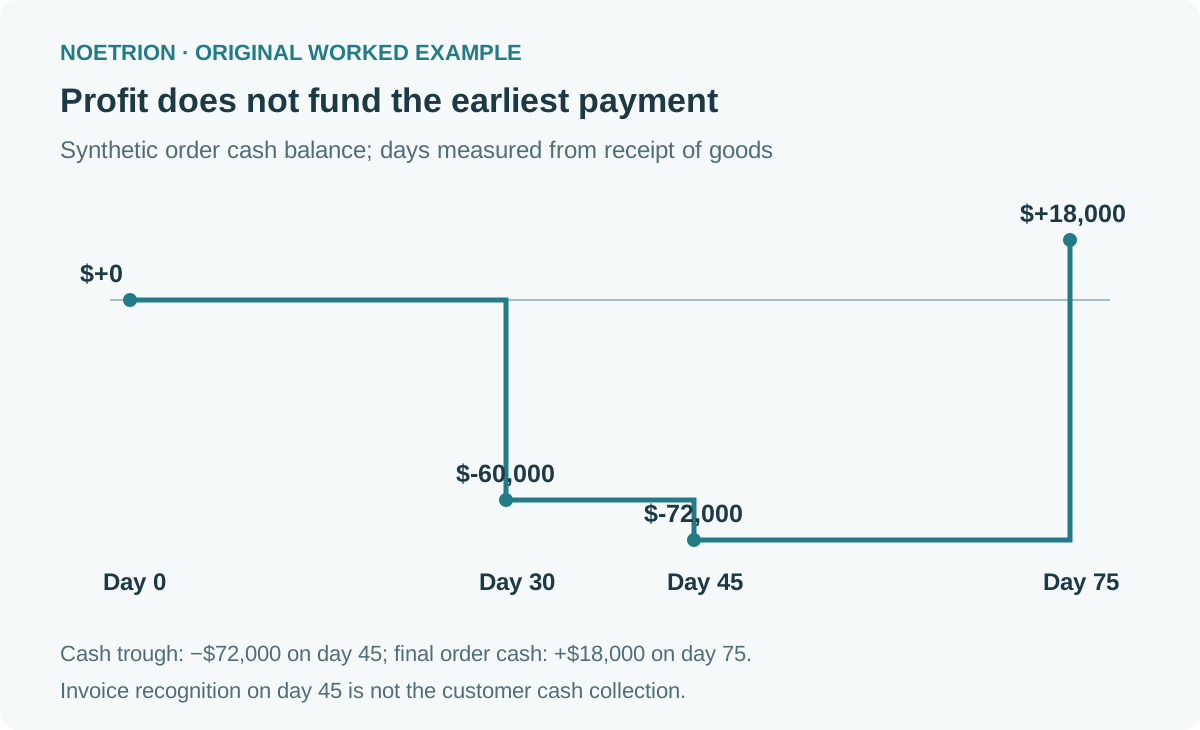
Now consider an independent synthetic order with the same timing pattern, rather than treating annual averages as a literal single transaction. Goods arrive on day 0, the supplier is paid on day 30, the goods sell and the customer is invoiced on day 45, and payment arrives 30 days later on day 75.
Assume this order has no opening cash allocated to it, no customer deposit, and no other receipts. The $12,000 operating payment occurs on day 45. These assumptions isolate the gap; they do not describe a complete company's cash forecast.
| Day | Event | Cash movement | Cumulative order cash |
|---|---|---|---|
| 0 | Receive $60,000 goods on supplier credit | $0 | $0 |
| 30 | Pay supplier | −$60,000 | −$60,000 |
| 45 | Invoice customer $90,000; pay operating costs | −$12,000 | −$72,000 |
| 75 | Collect customer payment | +$90,000 | +$18,000 |
The supplier-to-collection interval is 45 days. The largest modeled funding need is $72,000, despite the $18,000 profit. Opening cash or an available facility could cover it; without either, the order's attractive margin does not solve the day-30 payment obligation.
If another identical order starts before the first customer pays, the gaps can overlap. Forecast each order or customer collection bucket by date. Growth can increase the amount financed even when the average CCC remains unchanged.
Compare invoice changes by cash effect and cost
“Net 30” is a contractual due date, not proof that collection happens in 30 days. State when the clock begins: invoice date, delivery, customer acceptance, or approval of a complete document pack. A missing purchase-order reference can delay the effective start of that clock.
Using the synthetic order, compare three changes separately:
| Change | Collection or payment timing | Result under the stated assumptions |
|---|---|---|
| Net 15 customer terms, paid on time | Customer pays day 60 | Cycle falls to 30 days; peak remains $72,000 because costs still occur before collection |
| 20% customer deposit on day 0 | Receive $18,000 first; collect $72,000 day 75 | Peak order funding falls to $54,000 |
| Supplier agrees net 45 | Supplier paid day 45 | Cycle falls to 30 days; peak remains $72,000, with a shorter financing interval |
Shortening the gap does not necessarily reduce its peak. Deposits provide cash before costs; shorter terms reduce the deficit's duration. A supplier extension must be agreed; late payment can introduce fees, damage relationships, or jeopardize future credit.
An early-payment discount has a price. If the customer receives a 2% discount on $90,000 for paying on day 55 instead of day 75, collection becomes $88,200 and profit falls to $16,200 before financing effects. The business gives up $1,800 to accelerate collection by 20 days. Compare that dollar cost with the actual financing cost avoided, expected participation, and the margin on the order. Do not assume every customer takes the offer.
Identify what the average hides
A DSO of 30 days can combine prompt customers with a small number of severely overdue invoices. Sort receivables into aging bands, identify disputes, and separate collectible balances from amounts likely to be written off. An overdue balance can make the average look like a timing problem when the more serious issue is nonpayment.
Inventory days also mix fast sellers and unsaleable stock. Lower inventory can release cash but increase stockouts if replenishment is unreliable. DPO can rise because of negotiated terms or because the business has stopped paying on time. The same ratio movement can therefore describe improvement or distress.
Negative CCC is possible when customers pay before suppliers. It does not remove refund obligations, payroll, debt service, or seasonality. Service companies with little inventory should examine unbilled work, milestone acceptance, and customer deposits rather than forcing every cash delay into an inventory model.
Currency conversion, sales tax, acquisition effects, and changes in product mix can distort comparisons. Document treatment of each before concluding that a five-day movement reflects better collections. For the accounting logic behind recognition and balances, see the history of double-entry bookkeeping.
Turn the calculation into a weekly decision routine
Prepare a rolling cash forecast with expected collections, contractual supplier payments, payroll, taxes, and financing commitments. Show a base case and a delayed-collection case for large customers. Track forecast versus actual receipts so optimistic assumptions become visible.
For each proposed invoice change, record its effect on peak funding, days financed, gross margin, and customer acceptance. Assign an owner to resolve invoice disputes before offering a blanket discount. Measure outcomes using actual collection dates and consistent balances, then update the next forecast.
The useful result is a concrete answer: how much cash is needed, on which date, and which operational change alters that requirement? CCC starts the investigation. The dated forecast and explicit commercial terms finish it.
Primary sources, checked October 14, 2026: