Starting More Tasks Can Make the Board Busier Without Finishing More Work
Understand work in progress, throughput and average flow time. Use Little's Law carefully, define workflow boundaries and test a WIP limit without false promises.
Every team member has several active tasks, yet the finished column barely moves. The board looks busy because many items have started. That is an observation about unfinished work, not evidence that the system is delivering more completed results.
A work-in-progress limit makes the team choose what can enter the active workflow. Its value depends on what happens next: whether blocked work is resolved, reviews occur and finished items actually leave. A number written above a column cannot create missing skills or review capacity.
This evergreen guide uses original examples to explain the relationship between work in progress, throughput and average time in a defined system. It does not promise that lowering a limit will automatically increase productivity.
Draw the start and finish boundaries
Choose what counts as entering the system and what counts as leaving. For this example, an item starts when the team begins preparing a report and finishes when its reviewer accepts the report. The earlier request backlog is outside that boundary.
Work waiting for review is still inside. So is a started item blocked on clarification. Moving it to another column does not remove the unfinished commitment unless the workflow definition actually changes.
Keep that definition consistent when measuring. A duration measured from request arrival cannot be combined casually with a WIP count that begins only after preparation starts; they describe different systems.
Separate four useful measurements
The Kanban Guide, May 2025 edition, defines work in progress, throughput, work-item age and cycle time. The guide also asks teams to define how items move from started to finished and how WIP is controlled.
| Measurement | Meaning in this report workflow | Common confusion |
|---|---|---|
| WIP | Started reports not yet accepted | Number of employees who look busy |
| Throughput | Reports accepted per unit of time | Reports started per day |
| Item age | Elapsed time since a still-open report started | Its eventual completed duration |
| Time in the system | Start-to-acceptance duration for a report | Active preparation hours alone |
Here, time in the system uses the same boundaries as WIP. Other teams may call a different interval lead time or cycle time; define the interval rather than relying on the label alone.
Understand the average relationship
John Little's 1961 paper proves a relationship between mean number in a queueing system, arrival rate and mean time spent there under stated mathematical conditions. It is commonly written L = λW.
For the practical example, use a stable system with finite long-run averages, consistent item definitions and balanced entry and exit rates. Under those assumptions, throughput can represent the flow rate. Average time in the system equals average WIP divided by that rate.
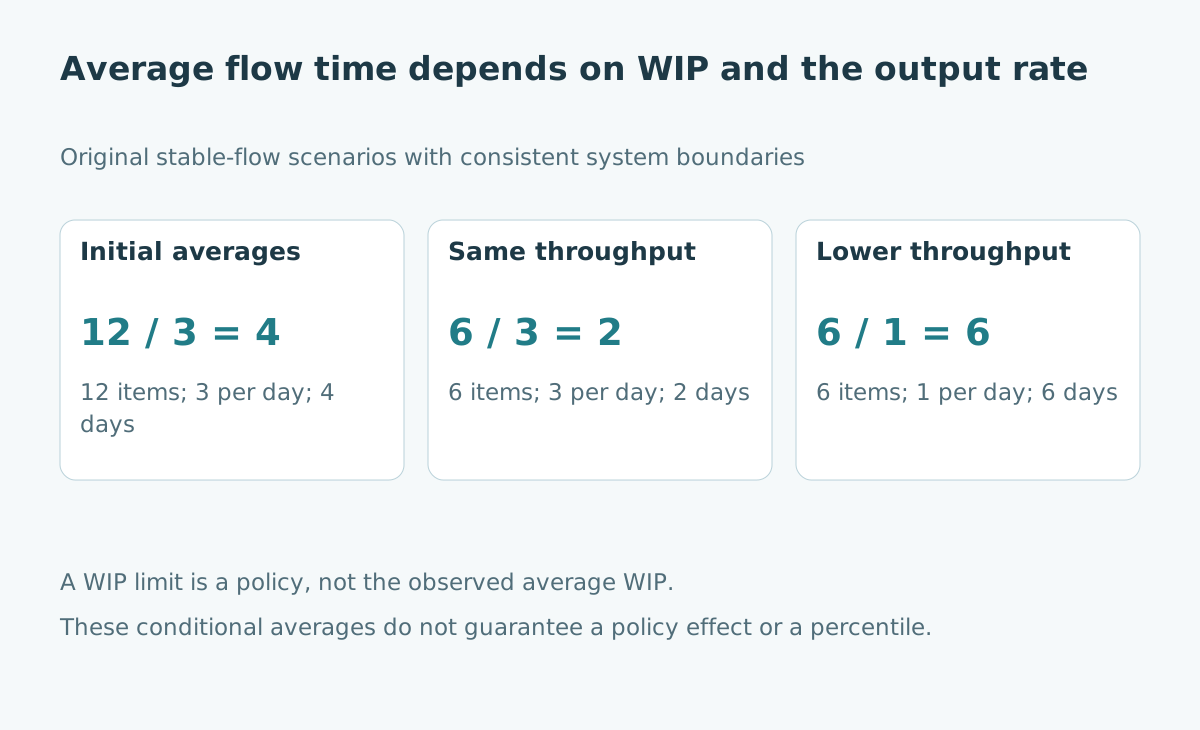
Twelve items divided by three items per day gives four days. The units cancel correctly, but the calculation is meaningful only when its quantities refer to the same system and compatible averages.
Compare scenarios without claiming a cause
Suppose a changed workflow eventually has average WIP of six items and still finishes three per day. The corresponding average time is two days. That is a conditional relationship, not evidence that setting a limit to six will produce those exact averages.
| Hypothetical stable scenario | Average WIP | Throughput | Implied average time |
|---|---|---|---|
| Initial system | 12 items | 3 items/day | 4 days |
| Less WIP; same output rate | 6 items | 3 items/day | 2 days |
| Less WIP; lower output rate | 6 items | 1 item/day | 6 days |
The third row prevents a misleading shortcut. If the output rate also changes, time need not improve. The relationship does not identify which policy will preserve throughput, why it changed or what WIP level is best.
Distinguish a limit from observed WIP
A WIP limit is a rule about admission. WIP is a measured number of unfinished items. Average WIP is that number averaged over time. These are related, but they are not identical.
A limit of six does not mean average WIP will be six. Items may finish before replacements begin, demand may be low or an upstream dependency may leave capacity unused. Conversely, a policy that ignores blocked items can understate the true unfinished work.
Agree which states count, what happens when the limit is reached and who can approve an exception. Record exceptions so a nominal limit is not mistaken for an enforced one.
Improve the constraint instead of hiding its queue
If reports wait for one reviewer, opening more preparation tasks may enlarge the review queue without changing that reviewer's output. Investigate whether the team can improve readiness, remove avoidable rework or arrange effective review support.
A WIP rule can create a prompt to help finish existing work before starting another item. It cannot guarantee that every person can perform every task. A specialist may need information or authority that other team members cannot supply.
Do not make the board look better by moving waiting reports outside the measured boundary while customers still experience the delay. If the boundary changes, show both the new measurement and the omitted interval.
Keep averages separate from promises
An average of four days does not mean every report finishes in four days, or that 95 % finish within four days. A long tail can coexist with a relatively modest average.
Inspect completed-item durations and the age of open items separately. Looking only at recently finished work can miss a very old blocked report that has not yet contributed a completed duration.
Short observation windows also have carryover: some items were already open at the start and others remain open at the end. Do not expect a snapshot count divided by last week's completions to reproduce an exact average duration.
Run a small, observable policy experiment
Before changing the rule, record the workflow definition, item types and current arrival, completion and WIP patterns. Choose a limit as a testable working policy rather than a mathematical optimum.
Agree to examine throughput, item age, rework and stakeholder outcomes after the system has had time to respond. Keep the reporting interval and item definitions stable. If work size changes, document that too: finishing more tiny reports is not automatically more value.
When outcomes differ from the expectation, inspect the constraint and assumptions. A policy experiment supplies evidence about this workflow; it does not establish a universal improvement percentage.
Connect flow to a usable team conversation
Ask three concrete questions: what is preventing an already-started item from finishing, what can the team do about that constraint and does admitting another item help the agreed objective? The answers are more useful than telling everyone to “be less busy.”
For transferring responsibility at a workflow boundary, see workplace handoff acceptance. For the difference between active effort and calendar duration, see task estimates and reference-class ranges.
The aim is observable completed work with understood waiting, quality and uncertainty. Lower WIP can be part of that design, but the evidence must show how the whole workflow responds.
Sources and limits
- Little, 1961, A Proof for the Queuing Formula: L = λW: primary mathematical paper; institution-hosted copy reviewed for assumptions and boundary consistency.
- The Kanban Guide, May 2025: original guide defining workflow control and flow metrics.
Checked October 27, 2026. All scenarios and the policy worksheet are original. The examples concern averages, not tail guarantees; no optimal limit, causal effect or team productivity gain is claimed.