An AI Hiring Index Can Rise Even When the Number of AI Hires Does Not
Interpret relative AI hiring indices without confusing share growth with more jobs. Use original ratio examples and new research to inspect the denominator.
A headline says AI hiring is growing faster than overall hiring. That can be informative without saying that the absolute number of AI hires increased. A relative measure can rise because its numerator grows, its denominator shrinks, or both change.
A preprint submitted on 12 October 2026, Do AI Activity Indices Really Measure AI Activity?, examines this problem in AI dashboards and employment analysis. Its authors argue that relative indices can mix changes in focal activity with broader hiring movements and shared shocks. This is recent author research, not a settled verdict on every labor-market dashboard or an independently replicated result presented by this article.
The practical question for a reader is narrower: which underlying quantities would have to move to produce the reported index change? Asking that question makes a chart more useful without discarding it.
Read the metric's complete name
A count of hires, a hiring rate, a share of postings, an index relative to a base year and a year-on-year change in a ratio are different objects. “AI hiring” is not a sufficient label to distinguish them.
The OECD.AI LinkedIn methodological note explains that its data reflect platform profiles and defines the relative AI hiring measure in relation to overall hiring, with a moving average. It also describes coverage and classification limitations. Read the exact series definition and display convention before translating a chart into a claim about jobs.
The examples below deliberately use a simpler share of hires. They isolate ratio arithmetic rather than reproducing the platform's complete methodology.
Recover the two levels behind a share
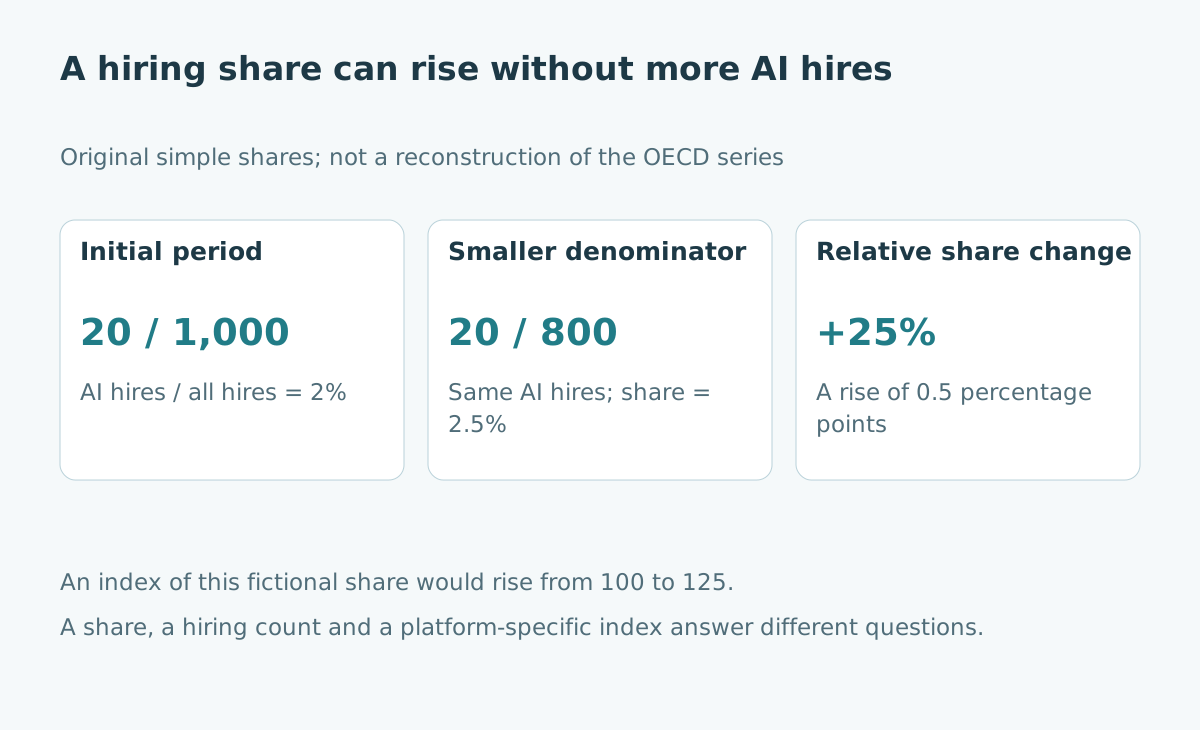
Imagine a fictional reporting period with 20 AI hires among 1,000 total hires. The share is 2%. In another period, AI hires remain at 20 while total hires fall to 800. The share becomes 2.5%.
The absolute share increase is half a percentage point. The relative increase in the share is 25%, calculated as 2.5 divided by 2 minus one. The number of AI hires has not changed.
| Original scenario | AI hires | Total hires | AI share |
|---|---|---|---|
| Starting period | 20 | 1,000 | 2.0% |
| Denominator falls | 20 | 800 | 2.5% |
| Both grow proportionally | 30 | 1,500 | 2.0% |
| Numerator grows, total fixed | 25 | 1,000 | 2.5% |
The two rows with a 2.5% share describe different levels. A share alone cannot tell the reader which occurred.
Distinguish relative growth from percentage points
The move from 2% to 2.5% is not 25 percentage points. It is 0.5 percentage points, or 25% relative growth from the initial share. Confusing the two can make a modest compositional shift sound dramatically larger.
A further indexed transformation can add another layer. If the starting share is assigned index 100, the new 2.5% share corresponds to 125 under that particular definition. The number 125 is not a count of hires or a 125% employment rate.
Record the unit and reference period beside the number. If a dashboard reports a growth rate of a ratio rather than the ratio's level, preserve that additional distinction in any summary.
Keep platform measurement separate from the whole economy
Profile updates are observations made through a platform's user population and reporting behavior. They need not represent every worker or every hiring event in a national economy.
A change in who uses the platform, how promptly profiles are updated or how skills are classified can affect measurement. The methodological note's coverage and classification information belongs beside the chart, especially in cross-country comparisons.
These are reasons to interpret the indicator within its scope, not reasons to declare it worthless. A well-defined platform series can reveal useful changes while remaining different from a census of employment.
Read the new paper as a measurement argument
The preprint's accessible full text develops an algebraic argument about ratio regressions and examines hiring-related employment associations. Its authors emphasize denominator disclosure, confounding and sensitivity to data choices, including a survey break in their application.
This article does not independently re-estimate those results or endorse every empirical conclusion. The original arithmetic table already establishes the basic point: a ratio does not uniquely identify the movements of its components.
The broader causal question requires more. Publishing numerator and denominator levels helps explain a descriptive movement, but shared economic shocks and selection can still prevent a causal interpretation.
Do not turn co-movement into displacement automatically
Suppose a relative AI index rises while employment in another group falls. That pattern alone does not establish that AI hiring caused those workers to lose jobs. A weak economy could lower overall hiring, change the ratio and reduce employment through another mechanism.
An original causal-review worksheet can separate the target outcome, proposed mechanism, alternative explanations, timing and comparison group. Ask what evidence would distinguish displacement from a denominator movement or a common shock.
Likewise, a statistically inconclusive association is not proof of no effect. The design's precision, effective variation and target effect size matter. A large nominal dataset can still provide limited information about the specific contrast being studied.
Build a small publication checklist
When presenting a hiring chart, include the exact metric name, population, time window, base period, smoothing, classification and source date. Where available, show component levels alongside relative movements.
| Original reporting field | Why a reader needs it |
|---|---|
| Numerator level | Shows whether focal hiring actually changed |
| Denominator level | Reveals broader hiring movement |
| Metric transformation | Distinguishes level, index and growth rate |
| Coverage and classification | Defines which people and roles enter the data |
| Interpretation boundary | Separates description from causal claims |
If the component levels are unavailable, state that limitation. Do not reverse-engineer precise counts from a normalized chart without the information needed to do so.
Use the indicator to ask a better business question
A hiring manager may care about the availability of a particular skill, compensation pressure or the time needed to fill a role. A national relative index may prompt investigation, but it does not directly measure all those local conditions.
Bring the external signal together with actual applicants, required skills, offers and completed hires, using consistent definitions. Preserve the possibility that a role's tasks changed without its job title changing.
The useful outcome is a bounded statement: the observed relative measure moved, its components are known or unknown, and these additional facts are needed for the decision. That is more informative than either treating the index as a complete employment story or dismissing it because it is a ratio.
Sources and limits
- Bertamini and colleagues, preprint submitted 12 October 2026 and accessible full text, checked 27 October 2026. Research framing reviewed; no independent empirical replication claimed.
- OECD.AI LinkedIn methodology, checked 27 October 2026. Definitions and coverage belong to the published platform measure.
- Related: AI career evidence and index weights versus breadth.
All hiring counts and share movements in the worksheet are invented. They are not country forecasts or estimates of AI-driven job displacement.