A Fixed Bond Coupon Does Not Mean a Fixed Market Price
Price a simple two-year bond at different yields, distinguish coupon from return, and connect interest-rate sensitivity with your cash-flow horizon.
Educational analysis, not a personal investment or payment recommendation. Check the dated sources and the rules that apply in your jurisdiction.
You buy a bond with a fixed coupon. The next statement shows a lower market value even though the issuer has made the promised payment. These observations can both be correct.
The coupon describes a contractual cash payment. The market price describes what someone would currently pay for the remaining cash flows. Keeping those two questions separate helps explain why a predictable payment schedule can coexist with a fluctuating valuation.
The SEC's interest-rate-risk bulletin explains the usual inverse relationship between market yields and fixed-rate bond prices. This article, checked on October 24, 2026, develops an original numerical example rather than a forecast of the next central-bank decision or a recommendation to buy a particular bond.
The example deliberately removes complications at first. After the mechanism is clear, we can add the risks and practical questions that a real decision requires.
Write the promised payments first
Assume a fictional bond has a face value of 100 monetary units, an annual coupon of 5% of face value and exactly two years until maturity. It pays annually. The issuer is assumed to perform in full.
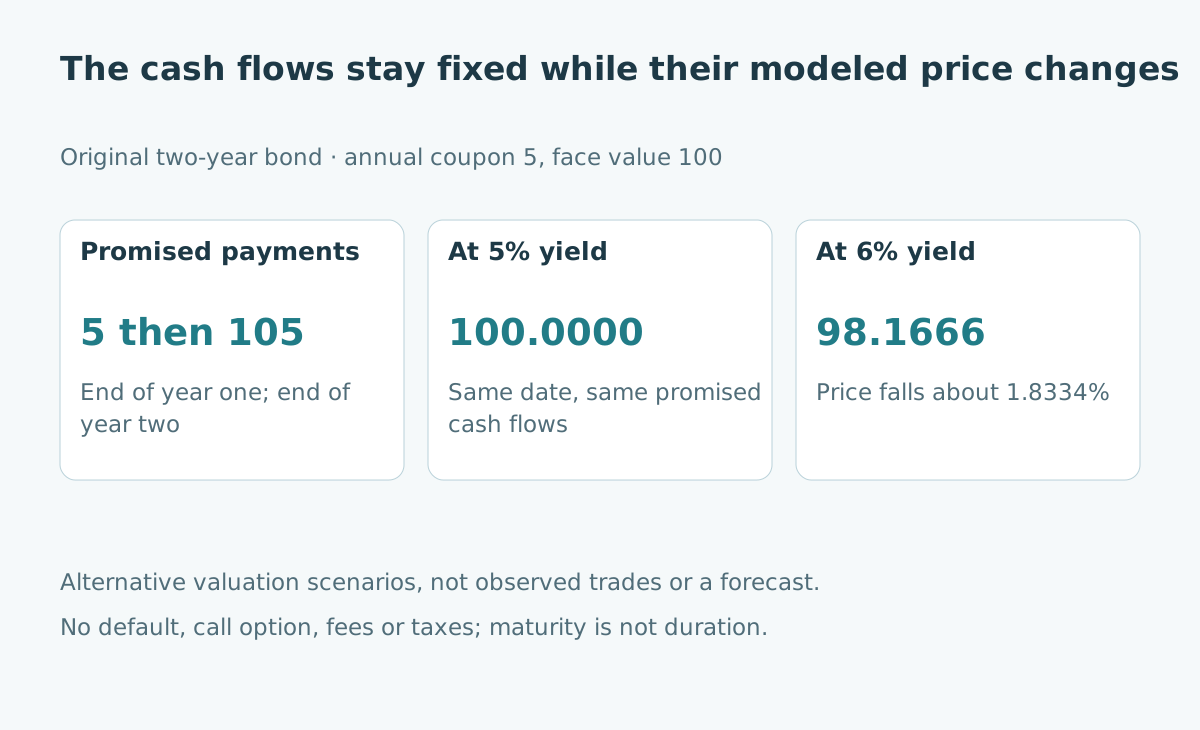
The year-one payment is 5. The year-two payment is 105, comprising the last coupon plus repayment of 100 principal. These payments are the input to the price calculation.
| Payment time | Coupon | Principal repayment | Total cash flow |
|---|---|---|---|
| End of year one | 5 | 0 | 5 |
| End of year two | 5 | 100 | 105 |
The face value is not necessarily the purchase price. A coupon rate of 5% therefore does not establish that every buyer earns 5% on the amount they invest.
Discount the same payments at different yields
Use a single annual yield, written as a decimal, for this simplified valuation. Price equals 5 divided by one plus yield, plus 105 divided by one plus yield squared.
At a 5% yield, the calculation is 5/1.05 + 105/1.05² = 100. At a 6% yield it is 5/1.06 + 105/1.06², approximately 98.166607.
| Annual yield used in the model | Calculated price | Change from price 100 |
|---|---|---|
| 4% | 101.886095 | +1.886095% |
| 5% | 100.000000 | 0% |
| 6% | 98.166607 | −1.833393% |
All three rows value the same promised cash flows at the same point in time. They are alternative scenarios, not a sequence of observed trades. No coupon has been paid between rows, and no holding period has elapsed.
Explain the price change without changing the coupon
A buyer considering the bond at the new yield requires a different price for the same future payments. A higher discount rate reduces their present value. The issuer does not need to change the coupon for that repricing to happen.
This distinction prevents a common misunderstanding: a lower statement value is not automatically evidence that a fixed coupon was cut. It can reflect changed market pricing of the remaining payments.
In a real bond, however, a price movement may also reflect credit concerns, liquidity or other changes. The toy example holds those influences outside the model so that the effect of yield is visible. It cannot identify the cause of an actual market move by itself.
Separate current yield from yield to maturity
At the modeled price of 98.166607, the annual coupon of 5 divided by price gives a current yield of about 5.0934%. This is a payment-to-price ratio. It leaves out the difference between purchase price and principal repayment.
Yield to maturity uses the full schedule of assumed payments in a discounted-cash-flow calculation. In this example the price was constructed using a 6% annual yield, so that yield solves the same pricing equation.
Neither label should be read as a guarantee about an investor's realized outcome. A sale before maturity, default, fees, taxes or the handling of interim coupons can change the result. If coupons are reinvested, the available reinvestment rates matter for terminal wealth.
Distinguish maturity from duration
Maturity tells you when the final promised payment is due. Duration measures aspects of the timing and interest-rate sensitivity of cash flows. They are related, but they answer different questions.
For the original model at a 5% yield, modified duration is approximately 1.8594 years. Multiplying it by a 0.01 increase in yield gives an approximate price change of −1.8594%. The exact calculation above gives −1.8334%.
The difference shows the limitation of a local approximation. Price is curved as a function of yield; one duration number does not reproduce every scenario exactly. The two-year maturity remains two years throughout this comparison. For more complex bonds, options and changing expected payments require additional care, rather than mechanical reuse of this formula.
Match the analysis to the cash need
Imagine two fictional owners of this same bond. One has a planned payment in six months and may need to sell. The other can potentially retain it until maturity. The market-price path matters differently to them because their liquidity needs differ.
Holding to maturity does not erase the issuer's obligation to perform, nor does it protect purchasing power from inflation. It also does not make the current economic value irrelevant. It changes which cash-flow scenario the investor is planning around.
Before comparing products, write down the date and currency of the cash need, whether sale may be necessary, and which losses would be unacceptable. A higher displayed yield is not an answer to those questions.
Add the risks the simple example excluded
Investor.gov's bond overview identifies credit, interest-rate, inflation, liquidity and call risks. These should be reviewed separately rather than compressed into a single idea of “safe.”
For an original assessment worksheet, place the promised cash-flow schedule beside a sale-before-maturity scenario. Then record the consequences of delayed payment, an unavailable buyer and a changed purchasing-power need. The worksheet will not produce a universal score; its purpose is to expose assumptions.
A bond fund introduces another boundary. A fund holding many changing positions does not ordinarily give its investor the same fixed principal-repayment date as this individual fictional bond. Read the product's actual structure before transferring the example to it.
Keep a reproducible valuation note
A useful note contains the valuation date, remaining payments, yield convention, price calculation and exclusions. Include the distinction between a market scenario and a forecast. Someone reviewing the note should be able to reproduce the number without guessing which payment frequency you used.
For further context, see investment fees and long-term decisions and index weights versus market breadth.
Sources and evidence limits
- SEC: Interest Rate Risk—When Interest Rates Go Up, Prices of Fixed-Rate Bonds Fall, checked October 24, 2026. Supports the price-yield mechanism and distinctions involving coupon and maturity.
- Investor.gov: Bonds—FAQs, checked October 24, 2026. Supports the risk categories.
The bond, prices and owner scenarios are original illustrations. They are not market quotations, personalized advice or predictions of realized returns.