Is a Business Pilot Worth the Cost? Calculate the Value of Information
Calculate when a business pilot can improve an investment decision, using explicit base rates, imperfect signals, delay costs, and a practical worksheet.
A pilot can become an expensive way to postpone a decision. It can also prevent a much larger mistake. The difference is whether its result could change what the business does, and whether that improvement is worth more than the test and the delay.
Before approving a pilot, write down the decision it will inform. Then ask what a positive result means, how often a weak opportunity could still produce that result, and what action follows a negative one. “We will learn something” is a starting point, not a business case.
Why uncertainty makes the question timely
The IMF's October 13, 2026 assessment of economic resilience identifies concentrated technology investment and uneven exposure to shocks as sources of risk. It is macroeconomic context, not a probability estimate for your project.
An earlier IMF Finance & Development analysis, published September 3, 2025, explains why uncertainty can increase the value of delaying irreversible investment. That mechanism does not imply that waiting is always best. A business may lose customers or useful operating time while it waits.
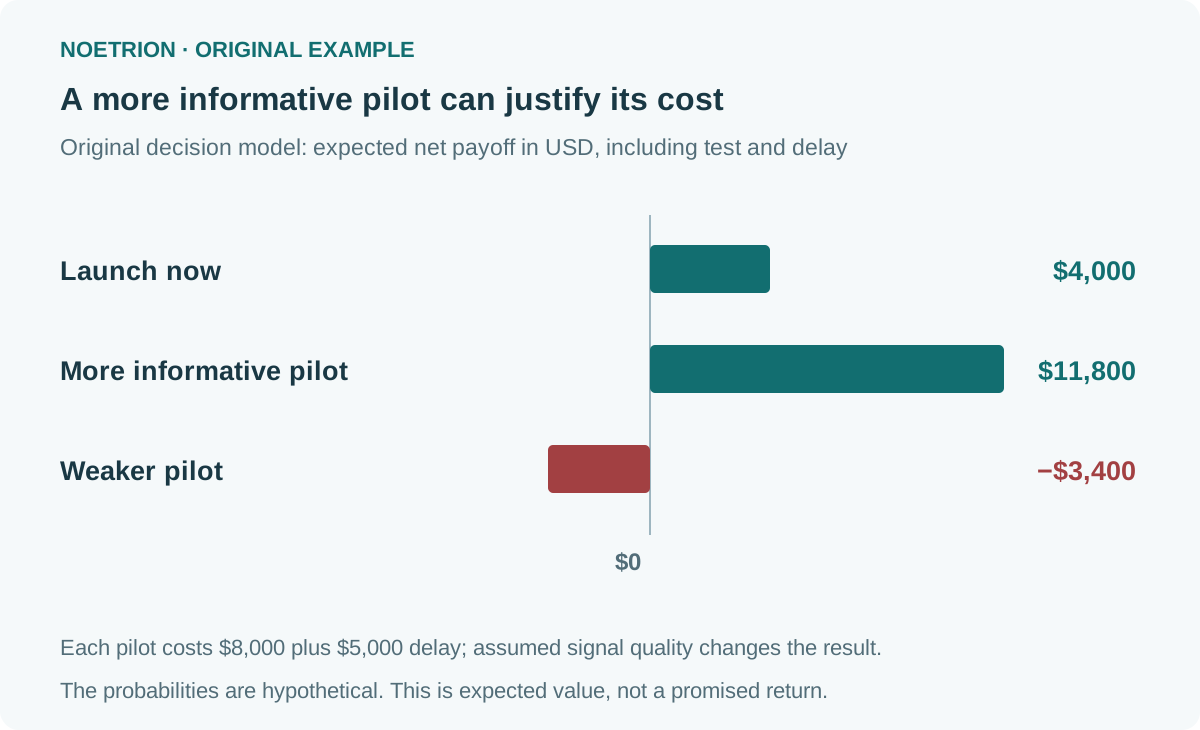
The original model below compares action now with a paid test followed by a contingent decision. It does not reuse the IMF's forecasts as company assumptions. Its purpose is to show exactly what must be believed for a pilot to be worth funding.
State the decision and payoff period
Imagine a company deciding whether to launch a service. After allowing for the investment and the operating costs included in its model, launch produces a net payoff of $100,000 if demand is strong and a loss of $60,000 if demand is weak. Not launching produces zero.
Assume a 40% prior probability of strong demand and 60% probability of weak demand. These are deliberately hypothetical judgments, not observed market frequencies. The expected payoff from launching now is 0.40 × $100,000 − 0.60 × $60,000 = $4,000. In this risk-neutral model, launch beats doing nothing.
| Actual demand state | Assumed probability | Launch payoff | Do-not-launch payoff |
|---|---|---|---|
| Strong | 40% | $100,000 | $0 |
| Weak | 60% | −$60,000 | $0 |
| Expected payoff before new information | 100% total | $4,000 | $0 |
Use a common valuation date and period. For real projects, discount relevant future cash flows consistently and avoid mixing revenue in one option with profit in another. Here the payoffs are already comparable net values, so no additional discount calculation is needed.
Describe the pilot as an imperfect signal
Suppose a pilot produces either a positive or negative result. Under strong demand, assume it is positive 80% of the time. Under weak demand, assume it is still positive 20% of the time. That second possibility matters: an encouraging test is not proof that the opportunity is good.
Combining the prior probabilities and signal assumptions gives four joint probabilities:
| Demand and pilot result | Calculation | Joint probability |
|---|---|---|
| Strong and positive | 40% × 80% | 32% |
| Weak and positive | 60% × 20% | 12% |
| Strong and negative | 40% × 20% | 8% |
| Weak and negative | 60% × 80% | 48% |
The entries sum to 100%. A positive signal occurs 44% of the time. Given that signal, the chance of strong demand becomes 32 / 44, or about 72.73%. After a negative signal, it becomes 8 / 56, or about 14.29%.
These updates follow from assumed signal performance. They do not demonstrate that a real pilot has 80% sensitivity or a 20% false-positive rate. Evidence for those inputs would need to come from relevant historical tests, a defensible model, or clearly acknowledged judgment.
Write the decision rule before seeing the result
Let p be the updated probability of strong demand. Launch has expected value 100,000p − 60,000(1 − p). It exceeds zero when p > 37.5%.
The positive signal raises the probability above that threshold; the negative signal leaves it below. The proposed rule is therefore to launch after a positive result and decline after a negative one. Precommitting to a rule helps prevent an enthusiastic team from redefining success after seeing disappointing evidence.
The expected payoff from the rule, before pilot and delay costs, is $24,800. One way to calculate it is to count the states in which launch occurs: 0.32 × $100,000 − 0.12 × $60,000. The other states lead to no launch and a payoff of zero.
The expected value of sample information is therefore $24,800 − $4,000 = $20,800. It compares the best action with the pilot signal against the best action without it. Comparing the pilot only with doing nothing would overstate its incremental value.
Charge the pilot for both spending and delay
Assume the test costs $8,000. Also assume a fixed $5,000 opportunity cost from the delay, valued on the same basis as the other payoffs and incurred regardless of the result. These costs are not already included in the launch payoffs.
The pilot strategy then has net expected value $24,800 − $8,000 − $5,000 = $11,800. Compared with launching immediately at $4,000, its expected advantage is $7,800.
The most the company could pay for this information, given the assumed $5,000 delay cost, is $15,800 before eliminating that advantage. Paying exactly that amount would make the two strategies equal in expected value. This is a model-specific ceiling, not a recommended budget or a market price for research.
Delay costs may depend on the result, the state of demand, or how long the test takes. If so, put them into the relevant branches instead of subtracting a convenient constant. Include pilot work that duplicates later implementation, but avoid double counting reusable work as both a pilot cost and a full launch cost.
Check how much weaker evidence changes the answer
Now suppose the pilot is positive 60% of the time under strong demand and 40% under weak demand. Positive outcomes occur with joint probabilities of 24% in each state, giving a 50% strong-demand probability after a positive result.
That still clears the 37.5% launch threshold. A negative result produces a strong-demand probability of about 30.77%, so the same action rule applies. Yet the information is much less valuable: the contingent launch payoff is 0.24 × $100,000 − 0.24 × $60,000 = $9,600 before testing costs.
| Strategy | Expected payoff before test and delay costs | Test plus delay costs | Net expected value |
|---|---|---|---|
| Launch immediately | $4,000 | $0 | $4,000 |
| More informative assumed pilot | $24,800 | $13,000 | $11,800 |
| Weaker assumed pilot | $9,600 | $13,000 | −$3,400 |
The weaker pilot's information is worth only $5,600 over the $4,000 immediate-launch baseline. Spending $13,000 to obtain it makes the strategy $7,400 worse than acting immediately. A pilot can produce useful information and still cost too much.
Design a test that can support the assumptions
NIST's experimental-design introduction emphasizes defining objectives and planning the experiment before execution. Its guidance on objectives distinguishes narrow initial comparisons from broader confirmatory work. A convenient demonstration should not be described as definitive market evidence.
For this service launch, define a measurable signal tied to actual demand: for example, an eligible customer's paid purchase under specified terms. A positive survey response and a paid contract are different outcomes. Choose the customer population and observation period so that the test resembles the decision you intend to make.
Record exclusions, recruitment, pricing, missing outcomes, and changes made during the test. If a pilot uses only friendly existing customers, its results may not transfer to a new market. If a team repeatedly checks results and stops at a favorable moment, a nominal success threshold can become misleading.
Noetrion's probability-calibration guide explains why a probability estimate needs more than a confident label. Its services-market entry worksheet helps specify the actual offer and costs before a market pilot is designed.
Put an upper bound on the research budget
Perfect information would reveal demand before the launch decision. In this hypothetical model, the company would launch only in the strong state, producing expected value of $40,000. Relative to the best immediate action's $4,000, perfect information is worth $36,000 before costs.
An imperfect signal that only informs this decision cannot be worth more than that perfect-information ceiling under the same model. If a calculation says otherwise, check whether the baseline, costs, or actions changed between comparisons. A pilot that also creates reusable capability may have additional value, but that is a separate benefit to identify and justify.
Before approving research, write a short decision record: available actions, payoff period, prior beliefs, signal definition, plausible signal quality, action rule, total cost, and stop date. Mark which inputs are evidence and which are judgments. Test less favorable assumptions rather than presenting one attractive expected value.
Expected value is not the entire decision. A business unable to survive the weak-state loss may need a smaller commitment even when the average looks favorable. The calculation should expose the trade-off and the value of learning, while leaving capacity, survival constraints, and responsibility visible.
Sources, dates, and limits
- IMF October 13, 2026 resilience assessment: current macroeconomic risk context only.
- IMF Finance & Development, September 3, 2025: uncertainty and irreversible investment mechanisms, not current project probabilities.
- NIST experimental design and experiment objectives: durable methodological guidance.
Checked October 21, 2026. Every payoff, probability, signal characteristic, and cost is hypothetical. Joint probabilities, conditional probabilities, and expected values were independently recomputed. No empirical calibration or guaranteed investment outcome is claimed.