A Screening Tool Can Find Cancer Earlier Without Proving That People Live Longer
Read AI cancer-screening claims by separating earlier detection from lives saved. Understand lead-time bias, length bias, overdiagnosis and useful trial endpoints.
This guide explains research and technology. It does not provide diagnosis or treatment, and regulatory status should be checked with the relevant authority.
A screening announcement reports more early-stage cancers and longer survival after diagnosis. Both sound encouraging. Neither, by itself, establishes that the screening program prevents deaths. The clock may have started sooner, or the program may have added diagnoses that would never have caused symptoms.
This distinction matters when assessing AI image analysis, blood-based tests and other early-detection technologies. A tool can improve detection while the evidence about downstream health benefit remains incomplete. The right question is which step the study actually tested.
This evergreen evidence guide explains three screening biases and offers an original claim-reading worksheet. It evaluates study logic; it does not recommend a screening schedule for an individual patient.
Start with the population and the clinical action
Screening seeks signs of disease in people without relevant symptoms. That is different from investigating a concerning symptom or using a diagnostic test after an abnormal screening result. The National Cancer Institute's screening overview makes this distinction and notes that a positive screen may require further evaluation.
Before interpreting a headline, write down who was tested, why they were tested and what happened after a positive result. An algorithm evaluated on images from already-diagnosed patients does not automatically establish performance in a general screening population.
Likewise, a diagnostic confirmation rate tells a different story from a reduction in cancer deaths. Keeping those actions separate prevents an accurate claim about one stage from expanding into an unsupported claim about the whole pathway.
Lead-time bias changes the starting line
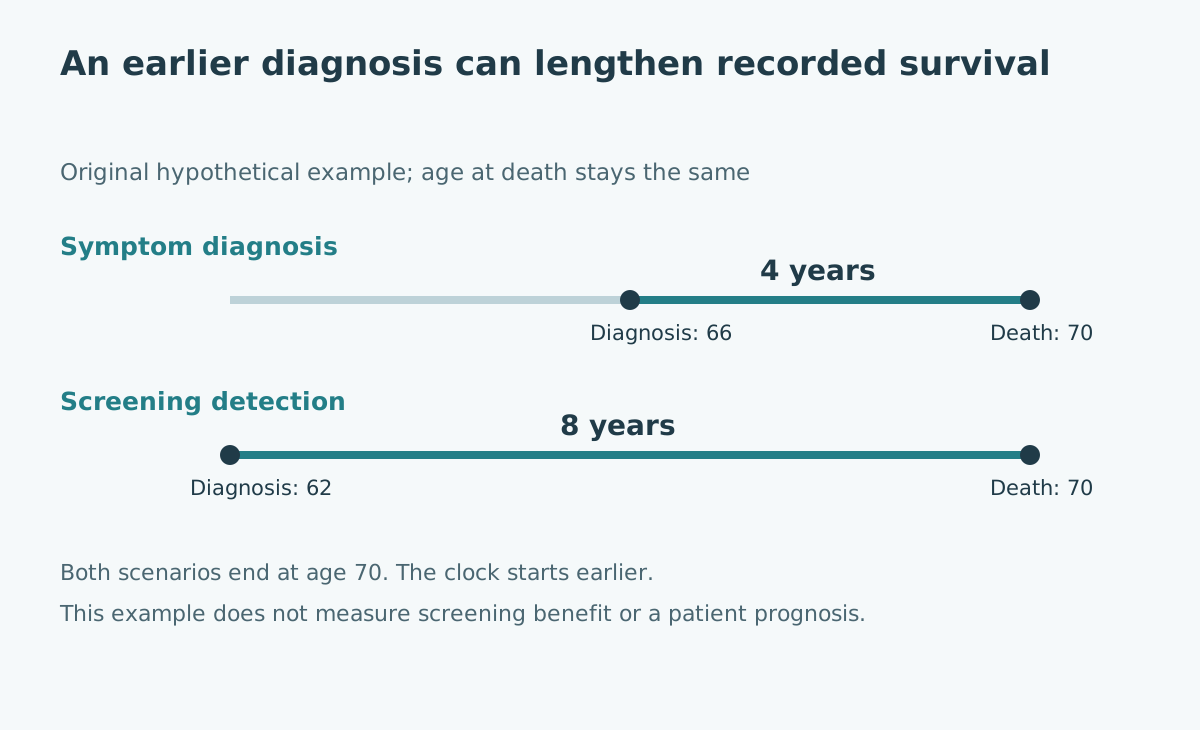
Imagine a fictional person whose cancer is diagnosed after symptoms at age 66 and who dies at 70. Recorded survival after diagnosis is four years. Now imagine screening detects the same disease at 62, but the person still dies at 70. Recorded survival becomes eight years, while lifespan remains unchanged.
The difference is 70 − 62 = 8 rather than 70 − 66 = 4. It measures how much earlier the clock began in this invented example, not treatment benefit. The NCI explanation of screening statistics describes this problem as lead-time bias.
Real screening can enable useful earlier treatment. The example shows why survival measured from diagnosis cannot separate that benefit from earlier labeling on its own.
Length bias changes which cancers are easiest to find
Some cancers spend longer in a detectable phase before symptoms than others. A screening round has more opportunities to encounter those longer-lasting phases. Screen-detected cases can therefore contain a disproportionate share of slower-growing disease.
The same NCI statistics guide calls this length-biased sampling. Better outcomes among screen-detected cases may partly reflect which cancers were found, rather than only what screening and treatment accomplished.
For a study review, compare groups defined by their original assignment or invitation to screening where appropriate, not only people whose cancers were found by different routes. A comparison restricted to detected cases changes the population being compared and can hide the selection mechanism.
Overdiagnosis is different from a false alarm
A false-positive result suggests a target that further assessment does not confirm. Overdiagnosis means detecting a real cancer that would not have become clinically apparent during that person's lifetime in the absence of screening. The distinction concerns the disease's future course, not whether the laboratory made up a result.
The NCI professional overview treats overdiagnosis and consequent overtreatment as potential harms. An individual diagnosis does not reveal with certainty what would have happened without screening. Estimating the extent requires appropriate population evidence and follow-up.
For a product assessment, request separate descriptions of false-positive investigations, diagnosed cancers and subsequent treatments. Counting all additional diagnoses as benefits assumes the point that the evaluation needs to establish.
Map each metric to the claim it can support
An original worksheet can keep a strong technical result from being mistaken for a completed clinical-benefit study. Fill in the study population and follow-up beside each metric.
| Reported result | What it can help establish | What remains to be shown |
|---|---|---|
| Higher sensitivity on a labeled image set | Detection of the defined target under the study conditions | Performance in the intended screening pathway |
| More early-stage cancers detected | A change in detection or stage distribution | Whether the change improves meaningful outcomes |
| Longer survival after diagnosis | Time lived after the diagnosis date | Whether age at death or mortality changed |
| Fewer cancer deaths in a suitable trial | Evidence about mortality benefit in that trial | Applicability, harms and implementation conditions |
This is a reasoning aid, not a ranking system for buying medical devices. Several metrics may be needed, and their definitions must remain intact.
Look for an outcome comparison with a credible denominator
The NCI National Lung Screening Trial questions and answers explains why randomized mortality comparisons can circumvent lead-time, length and overdiagnosis biases. A comparison needs the relevant population denominator and sufficient observation, not just the set of people eventually diagnosed with cancer.
Consider a fictional trial with 10,000 participants per group. If one group has 30 cancer deaths and another 24 over the same follow-up, the observed risks are 0.30% and 0.24%. The absolute difference is 0.06 percentage points, or six fewer deaths per 10,000 participants. The relative difference is 20%.
Those invented counts do not establish statistical significance or a real treatment effect. They demonstrate why a relative percentage should be accompanied by absolute counts, follow-up and uncertainty.
Keep benefit, harm and workflow on the same page
An AI detector may change the work sent to clinicians even when its final benefit remains uncertain. An operational review can ask how many additional assessments occur, who receives them and how long confirmation takes. Record how test-negative people are followed, since missed disease cannot be evaluated by checking positive cases alone.
Separate the initial test from repeat imaging, biopsy, treatment and monitoring. Then ask which of those steps were actually observed in the study. A laboratory accuracy report cannot supply missing follow-up outcomes.
For a fair comparison, preserve the target population, comparator and observation period. Avoid assembling an attractive composite from unrelated studies: one population's accuracy, another population's survival and a third setting's workflow are not a single demonstrated patient pathway.
Read the conclusion at the same level as the evidence
A defensible summary might say that a tool detected additional abnormalities in a specified dataset while clinical outcomes remain under study. That statement can recognize technical progress without claiming that every extra diagnosis extends life.
When mortality evidence exists, inspect its uncertainty, follow-up, comparison treatment and applicability. The finding still belongs to the evaluated program and population. For interpreting treatment-trial statistics, see risk, relative reductions and hazard ratios. For the development-to-deployment evidence chain, see medical AI evidence and regulation.
Sources and limits
- NCI, updated July 16, 2018: What Cancer Screening Statistics Really Tell Us: official explanation of lead-time and length biases.
- NCI, updated October 16, 2023: Cancer Screening Overview, professional PDQ summary: definitions, benefits, harms and evaluation principles.
- NCI, updated November 12, 2014: National Lung Screening Trial questions and answers: rationale for randomized mortality comparisons.
Checked October 28, 2026. This is an evergreen guide using official evidence explanations, not an assessment of a newly released screening product. Both numerical examples and the worksheet are original and hypothetical.