A Hazard Ratio Is Not the Percentage of Patients Who Avoided an Event
Separate hazard ratios, fixed-horizon risk and absolute differences when reading trial results. Use original examples to understand censoring and follow-up.
This guide explains research and technology. It does not provide diagnosis or treatment, and regulatory status should be checked with the relevant authority.
A clinical-trial headline says an intervention reduced a risk by 25%. It sounds precise, but several different calculations could sit behind that sentence. A relative reduction in the proportion experiencing an event by twelve months is not the same quantity as a reduction in the event hazard during follow-up. Neither says that 25 out of every 100 people benefited.
For readers evaluating medical research and the technology used to generate it, the useful habit is to ask three questions before interpreting the percentage: What event? Over what time? Which statistical measure? The answers determine what can be compared and what remains unknown.
This is an evergreen research-reading guide, checked October 27, 2026. It uses original numerical examples and established primary guidance, not an unverified announcement about a new treatment.
Name the endpoint before reading the effect
The FDA's December 2018 oncology endpoint guidance discusses distinct outcomes, including overall survival and progression-free survival. Those names do not describe the same event. Its recommendations concern trials treating existing cancer, not a universal template for every medical study.
In a reading worksheet, copy the endpoint's actual definition rather than shortening it to “risk.” Record when observation starts, what counts as an event, and whether the outcome combines several event types. If a composite endpoint changes, inspect its components instead of assuming that every component changed equally.
Calculate fixed-horizon risk with a clear assumption
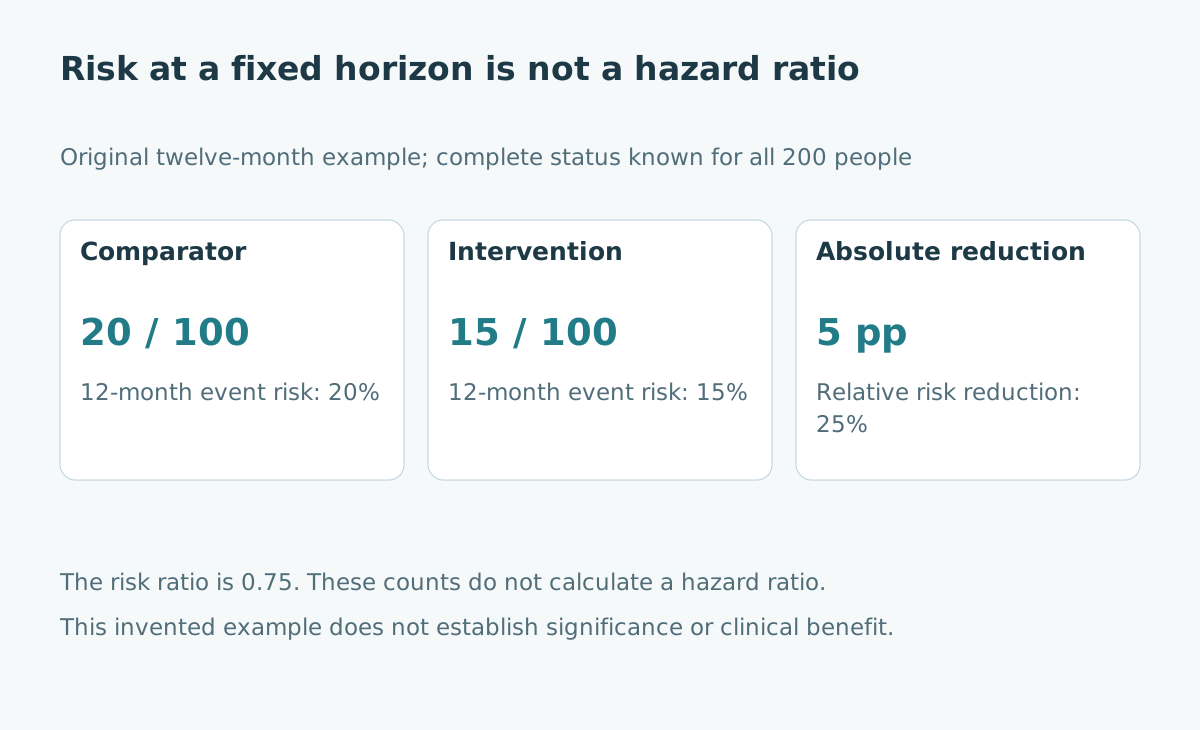
Consider a wholly fictional study with 100 participants in each group. By twelve months, 20 comparator-group participants and 15 intervention-group participants have experienced the specified event. Assume every participant's event status through that horizon is known, with no competing-event complication in this simplified exercise.
| Original measure | Calculation | Result |
|---|---|---|
| Comparator twelve-month event risk | 20 / 100 | 20% |
| Intervention twelve-month event risk | 15 / 100 | 15% |
| Absolute risk reduction | 20% − 15% | 5 percentage points |
| Risk ratio | 15% / 20% | 0.75 |
| Relative risk reduction | 1 − 0.75 | 25% |
All five rows describe the same invented counts. “Five percentage points” and “25% relative reduction” express different scales. Reporting both helps a reader see the starting risk as well as the proportional contrast.
Do not rename the risk ratio a hazard ratio
The National Cancer Institute's hazard-ratio definition describes a comparison of events over time. A hazard concerns the event rate at a time among people still at risk immediately beforehand. A cumulative risk instead concerns whether the event has happened by a specified horizon.
The table above contains no event-time information. The 15 events could occur early, late, or across the year; the 20 comparator events could follow a different pattern. Those possibilities can share the same twelve-month counts. Consequently, the risk ratio of 0.75 does not supply an estimated hazard ratio of 0.75. Equal-looking numbers do not make the measures interchangeable.
Keep follow-up time attached to each participant
Now consider a separate original three-record example. It illustrates what becomes uncertain when observation ends before the horizon; it is not a second arm of the fictional 100-person study.
| Record | Last relevant observation | What is known at that point? |
|---|---|---|
| Person A | Event at month 3 | The event occurred at month 3 |
| Person B | Event-free at month 6; later status unavailable | Event-free through month 6, not necessarily through month 12 |
| Person C | Event-free through month 12 | No event through the chosen twelve-month horizon |
Person B must not automatically be classified as event-free at twelve months. Nor should the missing later status be treated as an event at month six. These are different unsupported substitutions. The record retains information about the period actually observed.
Understand what Kaplan–Meier adds
The NIST description of Kaplan–Meier estimation explains a product-limit method using event times and the number still at risk at those times. Censored observations contribute information while observed, then leave later risk sets. This differs from dividing all observed events by the original enrollment count when follow-up is incomplete.
Using an appropriate method does not remove the need to examine why observation ended. The FDA guidance discusses potential bias from follow-up differences and censoring assumptions. A person lost because of deteriorating health may differ from a person whose observation ends at a planned data cutoff. The analysis must address the relevant assumptions; the curve alone cannot verify them.
Ask what a summary leaves out
A single hazard ratio compresses a time-to-event comparison. It does not by itself tell you the event probability in either group at twelve months, the absolute difference at that horizon, or how many additional months a particular person will live. Those require the relevant estimates and supporting analysis.
If curves separate late, cross, or have sparse follow-up near their ends, inspect the reported analysis and its interpretation rather than supplying your own conversion. A headline number should lead to the survival curves, numbers-at-risk display, confidence intervals, and stated horizon. Do not infer precision from the number of decimal places used in the headline.
Make a compact result-reading card
For an original evidence card, write the population, assigned groups, endpoint, observation start, data cutoff, and reported effect measure. Next, add the absolute estimates at a prespecified or otherwise clearly identified horizon, their uncertainty, and how many people remain under observation there.
If the report does not provide a needed quantity, mark it unavailable. Do not calculate a twelve-month survival probability from a hazard ratio alone. Also record whether a quoted result was prespecified, exploratory, or drawn from a subgroup. These distinctions help prevent several different analyses from being blended into one persuasive sentence.
Separate arithmetic from a clinical conclusion
The original 20-versus-15 example demonstrates arithmetic only. It has no confidence interval, study protocol, randomization record, safety data, or patient-reported outcomes. It cannot establish statistical significance, clinical importance, or a treatment recommendation. A real decision requires the complete evidence and an appropriate clinical discussion.
When a result is described as “25% lower,” keep the question open until the measure, endpoint, horizon, and absolute scale are clear. For related evidence checks, read why a biomarker change is not automatically patient benefit and wearable missing data and observation denominators.
Sources and reading notes
- FDA final-guidance information page, December 2018, and full guidance, particularly endpoint and analysis considerations.
- NCI Dictionary: hazard ratio.
- NIST handbook: Kaplan–Meier estimation. The original examples above teach interpretation, not clinical efficacy or a complete survival-analysis protocol.