A 150 kW Charger Does Not Promise a 150 kW Charging Session
Calculate charging time from delivered energy and a changing power curve. Separate charger ratings, vehicle limits, connection overhead and queue time.
The sign says 150 kW. Your car briefly reports a high charging rate, then the number falls. The session takes longer than a quick division of battery energy by the number on the sign suggested. That difference does not, by itself, establish that either the car or charger is faulty.
The rating describes a capability under applicable conditions. A journey depends on the power actually delivered throughout the required charge window, as well as the time spent reaching, accessing and leaving the charger.
The US Department of Energy's Alternative Fuels Data Center identifies battery state of charge, capacity, vehicle capability and charging equipment among the factors affecting charging time. This explanation was checked on October 25, 2026. It is a practical engineering guide, not a recommendation for a current vehicle or network.
Start with the energy you need
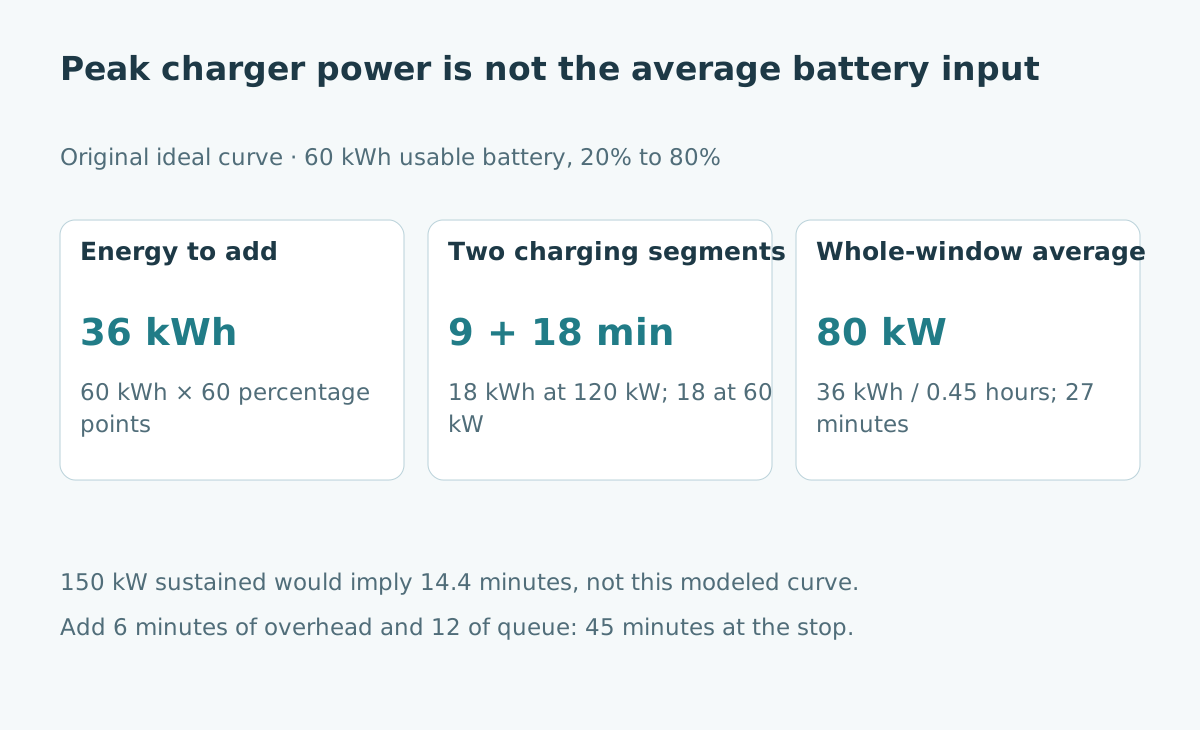
Assume a fictional vehicle has 60 kWh of usable battery capacity. For this simplified calculation, treat its displayed state of charge as linear in usable stored energy. Raising charge from 20% to 80% adds 60% of 60 kWh, or 36 kWh.
That is a battery-energy target, not necessarily the energy billed by the charging station. To keep the first example transparent, assume the stated power rates are net rates into the usable battery-energy balance. Real measurements require a consistent boundary.
Write that boundary before doing arithmetic. If one value comes from the station meter and another comes from the battery display, losses and auxiliary consumption can prevent them from matching exactly. Mixing the boundaries can make an accurate meter look inconsistent with an equally reasonable dashboard estimate.
Treat peak power as one point on a curve
A charging curve describes how charging power changes across the session. A high peak can coexist with a much lower average if the peak lasts only briefly.
Volkswagen's battery information explicitly notes that charging times depend on the charging curve, battery and charger conditions, and temperature. Its explanation includes slowing at higher charge levels. That is manufacturer guidance about its context, not a universal measured curve for every vehicle.
For a comparison, ask for power across the same starting and ending charge levels under stated conditions. A peak without its duration and test conditions cannot answer how long your required energy addition will take.
Add time segment by segment
In the original fictional curve, the first 18 kWh enters at a constant 120 kW. Time is energy divided by power: 18/120 hours, or nine minutes. The next 18 kWh enters at a constant 60 kW, taking eighteen minutes.
| Segment | Battery energy added | Assumed constant net power | Ideal time |
|---|---|---|---|
| First half of the energy addition | 18 kWh | 120 kW | 9 minutes |
| Second half of the energy addition | 18 kWh | 60 kW | 18 minutes |
| Complete 20%–80% window | 36 kWh | Variable | 27 minutes |
The complete time is twenty-seven minutes. A real curve would usually need more segments or an appropriate numerical integration, rather than an abrupt step between two perfectly flat rates. The simple form makes the denominator error easy to see.
Calculate the correct average power
The average net power over this charging window is 36 kWh divided by 0.45 hours: 80 kW. It is not the arithmetic average of 120 and 60, which would be 90 kW.
The car spends twice as much time at the slower rate. A time-weighted calculation gives the same answer: nine minutes at 120 plus eighteen minutes at 60, divided by twenty-seven minutes, equals 80.
Using the 150 kW nameplate as if it were sustained gives 36/150 hours, or 14.4 minutes. That is a hypothetical constant-power calculation, not the time produced by this curve. Even using the 120 kW peak throughout would predict eighteen minutes, still shorter than the modeled session.
Identify which limit is binding
A higher-rated charging point helps only when the rating is actually the constraint for the relevant portion of the session. If the vehicle would accept no more than 120 kW under the assumed conditions, replacing a 150 kW unit with a larger-rated unit does not change the invented curve by itself.
| Observation | Question to investigate | What the observation alone cannot prove |
|---|---|---|
| Power stays below the sign's rating | What can the vehicle accept now? | Charger failure |
| Rate falls as charge increases | What does the expected curve show? | A fault in the battery |
| Two sessions differ | Were conditions and charge windows comparable? | Which component caused the difference |
| Station power is constrained | Is site capacity shared or otherwise limited? | Every connector always delivers its nameplate |
These are diagnostic questions, not instructions to override vehicle safeguards. The vehicle and equipment documentation define the applicable operating conditions.
Separate charging minutes from stop minutes
Now add another original assumption: connection and payment take four minutes, and disconnecting and preparing to leave take two. The twenty-seven-minute charging period becomes a thirty-three-minute stop without a queue.
If the driver waits twelve minutes before connecting, the stop becomes forty-five minutes. The charging curve is unchanged in both cases. The difference comes from the service around the energy delivery.
This distinction matters when comparing routes. A slightly faster energy transfer may not produce the shorter journey if it requires a longer detour or uncertain access. Conversely, a convenient stop might align with a break the driver wanted to take anyway. Record these components separately before assigning value to a faster charger.
Compare sessions using a small measurement sheet
An original measurement sheet can contain arrival charge, departure charge, usable capacity assumption, energy-meter location, energy delivered, charging start and end, and arrival and departure times. Add vehicle configuration and the environmental conditions available to you.
Keep the first attempt, including a failed connection or interrupted session. Removing unsuccessful visits creates a more flattering picture of the service than the driver experienced.
A single visit remains one observation. Several sessions under different conditions can reveal useful variation, but they do not automatically establish the cause. If the goal is equipment diagnosis, preserve the relevant error messages and use the operator's support process rather than inferring a hardware defect from average power alone.
Plan around the required window
The useful question is how to obtain enough energy for the next leg with an appropriate margin under the vehicle's guidance. It is not necessarily how to maximize the charging percentage at every stop.
Avoid treating any percentage window as a universal battery-care instruction. Trip requirements, vehicle instructions and conditions differ. Use comparable energy windows when evaluating performance, and leave room for the uncertainty of the actual journey.
The same distinction between power and stored energy appears in battery sizing in MW and MWh. For another example of a local speed claim versus complete output, see robot cycle time and production throughput.
Sources and evidence limits
- US Department of Energy AFDC: Electric Vehicle Charging Stations, checked October 25, 2026. Supports the dependence of time on vehicle, battery and equipment conditions.
- Volkswagen Singapore: Battery Technology, checked October 25, 2026. Supports the manufacturer explanation of changing charging power and condition-dependent charging times.
All numerical curves, overheads and waiting times are invented teaching examples. They are not product specifications or observed network performance.