A Forecast Meeting Adds Value Only If Its Changes Improve the Comparison You Care About
Audit forecast overrides with archived baselines, matched outcomes and a worked forecast-value-added ledger. Separate accuracy improvements from business value.
A demand-planning meeting ends with a new forecast. Sales knows about a promotion, operations worries about supply and management prefers a more ambitious target. The final number may be better informed than the original. Without preserving the original, nobody can tell whether the meeting improved the forecast or simply changed it.
Forecast value added, or FVA, is a way to compare stages of a forecasting process against the same later outcome. Its useful question is concrete: did this intervention reduce the chosen loss relative to the comparator that was available before the intervention?
Preserve the forecast before evaluating the meeting
An audit needs archived versions: the simple benchmark, the statistical baseline, each intervention stage and the final forecast. Keep their issue times, target periods, horizons and units. Once the actual arrives, add it without replacing the earlier versions.
Forecast Pro's own FVA documentation describes comparisons between archived baseline forecasts and subsequent overrides. Its product view distinguishes improvement relative to the initial baseline from improvement at an individual process step. This is documentation of a specific implementation, not proof that a particular planning organization gains value from meetings.
A spreadsheet can implement a simpler audit if it preserves those boundaries. A single column repeatedly overwritten as “latest forecast” cannot reconstruct what decision makers actually knew at an earlier point.
Give the baseline a fair chance
A suitable naive or seasonal-naive comparator can reveal whether a complex process beats a transparent starting point. Choose it before examining results and match the forecasting horizon.
Hyndman and Athanasopoulos' forecasting textbook presents simple benchmarks and emphasizes evaluation on genuine forecasts for observations not used in fitting. That means a retrospective fitted value should not be substituted for a forecast that was actually available before the outcome.
For an original audit, record whether a promotion was known by the issue date. A final forecast using information that arrived two weeks later is not a fair comparison with a baseline frozen a month earlier unless the different information windows are explicitly part of the process being evaluated.
Calculate an original four-case ledger
Assume four comparable item-period cases with a common unit and fully observed actual demand. All forecasts were fixed at the same cutoff. The invented simple benchmark is 100 for each case; the statistical baseline and final overridden forecast vary.
| Case | Actual | Simple benchmark | Statistical baseline | Final forecast | Baseline absolute error | Final absolute error |
|---|---|---|---|---|---|---|
| A | 100 | 100 | 90 | 100 | 10 | 0 |
| B | 120 | 100 | 110 | 125 | 10 | 5 |
| C | 80 | 100 | 90 | 100 | 10 | 20 |
| D | 100 | 100 | 110 | 105 | 10 | 5 |
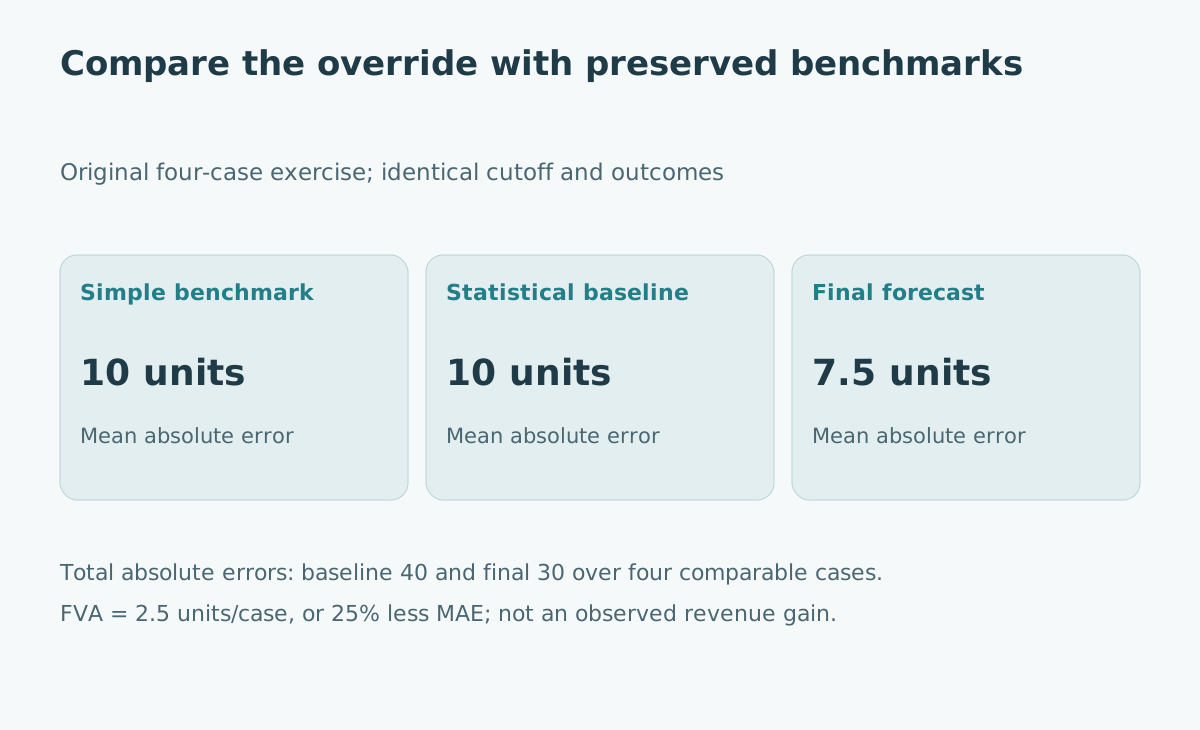
The statistical baseline's absolute errors sum to 40, giving mean absolute error, or MAE, of 10. The final errors sum to 30, giving MAE 7.5. The simple benchmark also has MAE 10, from absolute errors 0, 20, 20 and 0.
Under the chosen convention, FVA = baseline MAE − final MAE = 10 − 7.5 = 2.5 units per case. Relative to the baseline MAE, that is a 25% reduction. It is not a 25-percentage-point change or a 25% increase in revenue.
Inspect who was helped and who was harmed
The average improvement hides case C, where the override increases absolute error from 10 to 20. Case A improves by 10, B by 5, C deteriorates by 10 and D improves by 5. The net reduction in total absolute error is 10 units across four cases.
This does not identify why a particular change helped. An override could reflect useful information, an optimistic target, a mechanical rule or luck. Record its reason and the information available when it was made, then inspect repeated outcomes for similar reasons.
For example, separate a documented, already-announced promotion from an unsupported request to raise a forecast. The categories are useful for later review, but this four-row exercise cannot establish their average effects in a real organization.
Keep the evidence about judgment appropriately bounded
Fildes and colleagues' 2009 study analyzed more than 60,000 forecasts and outcomes from four supply-chain companies. Its author abstract reports average accuracy improvements from judgmental adjustment in three companies, alongside substantial differences by adjustment size and direction. Smaller adjustments often harmed accuracy, and upward adjustments were less likely to improve it than downward ones.
Only the primary abstract and publication record were available for this review. Those findings neither prove that your small adjustment is harmful nor that a large one is justified. They support evaluating the process rather than assuming every intervention adds value.
A useful local decision is to examine the repeated interventions that consume time but show little improvement, while retaining justified exceptions and documenting what the audit cannot infer.
Translate forecast accuracy into a separate decision model
MAE treats an underforecast of 10 units and an overforecast of 10 units equally. A business may not. Under an original hypothetical cost rule, suppose one unit of unmet demand costs 3 currency units and one excess unit costs 1. Those equal-sized errors then cost 30 and 10 respectively.
Applying that rule mechanically to the four invented cases gives baseline costs 30 + 30 + 10 + 10 = 80 and final costs 0 + 5 + 20 + 5 = 30. This is a second illustrative comparison, not an inventory optimization or profit calculation.
Real business consequences depend on order quantities, lead times, lost sales, backlogs, inventory carried across periods and other constraints. A forecast is an input to a decision; it is not necessarily the quantity ordered. State how the decision follows from the forecast before calling an error reduction a financial saving.
Evaluate matched cases and representative exceptions
If only overridden cases enter the audit, the result describes selected cases, not the whole process. Compare the same cases across versions and separately record how often interventions occur. Include unresolved actuals and explain exclusions.
Also check whether observed sales equal demand. Stockouts can suppress sales, so an apparently accurate forecast of recorded sales might still miss the demand the business could have served. Resolve the outcome definition before comparing methods.
Avoid mixing horizons or units into an unqualified average. A short-horizon forecast and a long-horizon forecast face different information constraints. A unit error for a high-volume item also has a different interpretation from the same error for a rarely sold item. The regression-metric guide explains metric choices; FVA adds the process-stage comparison.
Use the audit to change the process
Set a review date and ask which recurring interventions should be retained, investigated or tested with a lighter workflow. Record meeting time and implementation effort beside the accuracy results; compare an improvement with its cost.
Keep a new evaluation period after changing the process. Rewriting past forecasts to reflect a lesson destroys the evidence needed to learn whether the lesson improves future work. For choosing decision evidence under uncertainty, see business pilots and value of information.
The useful output identifies where the process improves a defined comparison, where it damages it and what the team will test next.
Sources and evidence limits
- Forecast Pro, FVA Report View, product-owned documentation checked 31 October 2026; archived comparisons and process-stage logic reviewed.
- Hyndman and Athanasopoulos, Forecasting: Principles and Practice, authors' textbook, simple-method and evaluation sections checked 31 October 2026.
- Fildes, Goodwin, Lawrence and Nikolopoulos, 2009, primary study abstract and publication record reviewed; full text unavailable from that repository.
All four-case figures, cost assumptions and process-review suggestions are original illustrations. They do not demonstrate a particular firm's forecast performance or the causal value of a specific intervention.