A PMI of 53 Does Not Mean the Economy Grew by 3%
Read PMI headlines without confusing an index level with GDP growth. Use original diffusion examples, a flash-data checklist and a business decision worksheet.
A business owner sees a PMI above 50 and raises the sales forecast by the distance above that threshold. The calculation looks tidy. It also assigns a percentage meaning that the index does not have.
October's flash survey cycle is a good occasion to revisit this distinction. The S&P Global release listing lists flash releases dated 23 October 2026. This article explains how to interpret that kind of release; it does not reproduce a current country reading that cannot be verified from an accessible release. Every numerical survey example below is original and fictional.
The useful question is what a survey reading tells you about the direction and spread of change, and how much additional evidence you need before turning it into a business commitment. An early signal can be valuable without being a direct measurement of your future sales.
Begin with the variable being measured
“PMI” can refer to a survey family, a manufacturing headline index, or a particular output or services activity measure. Read the exact series name before interpreting a number.
S&P Global's methodology describes questions about changes compared with the previous month. Its PMI FAQ distinguishes the manufacturing headline's weighted components from an output measure. It also describes flash readings as early estimates using most, rather than all, monthly responses.
For a simple diffusion index, the formula is the percentage reporting higher plus half the percentage reporting unchanged. A reading above 50 indicates an increase on the measured dimension relative to the previous month; below 50 indicates a decrease. It is an index scale, not a percentage growth rate.
Build the number from responses
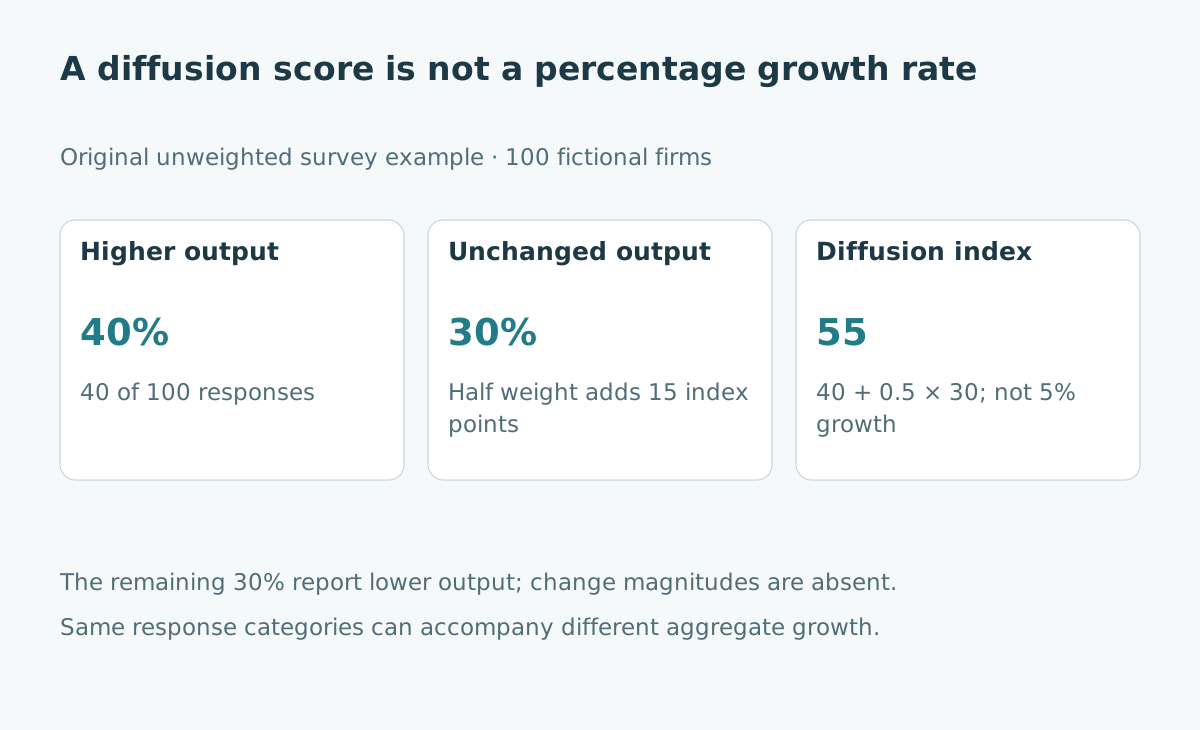
Take 100 fictional firms answering an output question. Forty report higher output, 30 report no change, and 30 report lower output. The simple diffusion index is 40 + 0.5 × 30 = 55.
The index exceeds 50 because more respondents report an increase than a decrease. Yet the questionnaire categories do not tell us the size of those increases and decreases. They also do not supply the value of each firm's output.
| Fictional response | Firms | Percentage | Index contribution |
|---|---|---|---|
| Higher | 40 | 40% | 40 |
| Unchanged | 30 | 30% | 15 |
| Lower | 30 | 30% | 0 |
| Total | 100 | 100% | 55 |
Real survey construction involves panel design and weighting. This deliberately simple example isolates the arithmetic; it is not a reconstruction of a published national index.
See why magnitude is missing
Suppose all firms in the toy example started with the same output. In scenario A, the 40 growing firms each expand by 1%, while the 30 shrinking firms each contract by 10%. Aggregate output falls by 2.6%: 0.40 × 1% minus 0.30 × 10%.
In scenario B, the categories stay identical but the growing firms each expand by 10%, while the shrinking firms each contract by 1%. Aggregate output rises by 3.7%. The simple diffusion index is still 55 in both cases.
This does not make diffusion indexes useless. It shows what information a category-based summary retains and what it discards. You need a separately estimated relationship, relevant data and uncertainty analysis to translate such a signal into a numerical growth estimate. The translation is not accomplished by subtracting 50.
Separate a level from a change in the index
A hypothetical index moves from 58 to 53. It is still above 50, so the directional signal remains expansion. The lower reading suggests less widespread or weaker growth momentum on that survey measure; it does not, by itself, say that output contracted.
Conversely, a move from 44 to 48 is an improvement in the index while remaining below the no-change threshold. Conditions can be deteriorating more slowly. Readers often confuse “better than last month” with “now expanding,” especially when a headline emphasizes only the index change.
| Hypothetical movement | Direction signal at new reading | What cannot be concluded directly |
|---|---|---|
| 58 to 53 | Expansion, weaker signal | Output fell by five percent |
| 44 to 48 | Contraction, less weak signal | Output returned to growth |
| 49 to 51 | Crosses the no-change threshold | GDP rose two percent |
The index's movement and its position relative to 50 answer different questions. Keep both in your reading notes.
Treat flash as a version of the evidence
An early estimate is useful partly because it arrives before the final result. That benefit comes with incomplete responses and potential revision. Record whether a figure is flash or final, its reference month, publication date, and the precise series.
If a later version differs, retain the earlier value when reconstructing a decision made at that time. Replacing the old evidence with the final figure creates a misleading history of what the decision-maker knew.
For example, a procurement note might say that an early survey strengthened concern about demand but did not justify changing an annual purchase commitment. A later revision can inform the next decision without making the earlier record disappear.
Bring the signal back to your own business
A national services measure may be only loosely connected to a small manufacturer's customers. A manufacturing headline can also combine pressures with different implications for your operation. More orders, longer delivery times and rising input costs do not all call for the same action.
Create a small bridge from external signal to internal evidence. Check quotations requested, confirmed orders, cancellations, conversion rates and supplier lead times. State the time period and whether a change reflects volume, prices, or customer mix.
An original decision rule might be: use a weaker survey as a reason to review next month's reorder quantities, then require a sustained change in confirmed orders before reducing a long-term capacity contract. That is a proposed management rule, not a statistically validated forecasting model.
Make reversible decisions while evidence accumulates
Divide responses by commitment. Updating a scenario worksheet is easy to reverse. Signing a multiyear lease is harder. The same survey signal may be sufficient for the first action and insufficient for the second.
Write down the additional observation that would change the decision. “Watch the economy” is vague; “reassess when our confirmed order coverage falls below the team's agreed threshold” is inspectable. Choose a threshold using your own economics, not a generic index rule.
Do not react to every small monthly movement as though it were a fresh regime. A decision process should distinguish meaningful new evidence from repeated attention to the same uncertain signal.
Keep an interpretation worksheet
Use five fields: exact series, reference period and release version, level and change, relevance to the business, and proposed next action. Add the primary release link so another person can inspect the wording and definitions.
A good reading note ends with a bounded conclusion: the survey has changed a scenario or prompted a check. It should not claim a precision the underlying statistic does not provide. PMI can help you notice a change early; understanding its scale helps you avoid converting that early warning into a false measurement.
Sources and further reading
- S&P Global PMI release listing, checked 24 October 2026; current release text was not used for numerical claims.
- S&P Global PMI methodology and methodology FAQ, checked 24 October 2026.
- Related: economic data revisions and economic forecasts as business scenarios.