A Smooth Private-Credit NAV Does Not Tell You How Quickly You Can Get Cash
Separate reported fund value from available cash and investor exit terms. Use original NAV and repurchase examples to ask clearer private-credit questions.
Educational analysis, not a personal investment or payment recommendation. Check the dated sources and the rules that apply in your jurisdiction.
A fund reports a tidy sequence of net asset values. Its underlying borrowers do not trade on an exchange every day, and investors can request withdrawals only through a specified process. The smooth chart and the withdrawal process describe different things.
This distinction matters as private credit receives renewed attention. A BIS working paper published on October 20, 2026 studies how bank liquidity regulation contributed to private-credit growth. Its authors explicitly leave overall systemic-risk effects outside the paper's scope. It is not evidence that every private-credit fund is safer, riskier or easier to exit than a bank or public security.
The investor's narrower task is to understand three objects: the valuation method, the fund's cash resources and the investor's contractual exit route. None can be inferred from a chart alone.
Separate the underlying asset from the wrapper
Private credit describes a broad lending market. An interval fund, a tender-offer fund, a non-traded business development company and a traditional closed-life private fund are different structures for holding assets and serving investors.
The Federal Reserve's October 14, 2026 research note describes differences in semiliquid funds' liquidity arrangements and holdings. It also discusses limited transaction-based valuation signals for private assets. These observations support asking about the particular vehicle; they do not make all private funds interchangeable.
Start with the legal structure and the actual documents. An asset-class label cannot tell you when a repurchase offer occurs, whether requests can exceed the amount offered, or what price date applies.
Know what the reported NAV represents
In a simplified fund, net asset value is assets minus liabilities. Per-share NAV divides that value by shares outstanding. The hard part is often the value assigned to assets that lack an immediately usable market quotation.
The SEC's fair-value compliance guide explains the role of fair-value determinations when market quotations are not readily available for covered funds. A model-based value is not automatically improper. It also is not the same thing as an executable bid for the whole portfolio today.
Ask which inputs changed since the prior report, which remained estimates and what events trigger a reassessment. Frequency of publication and freshness of every underlying input are separate questions.
Work an original valuation example
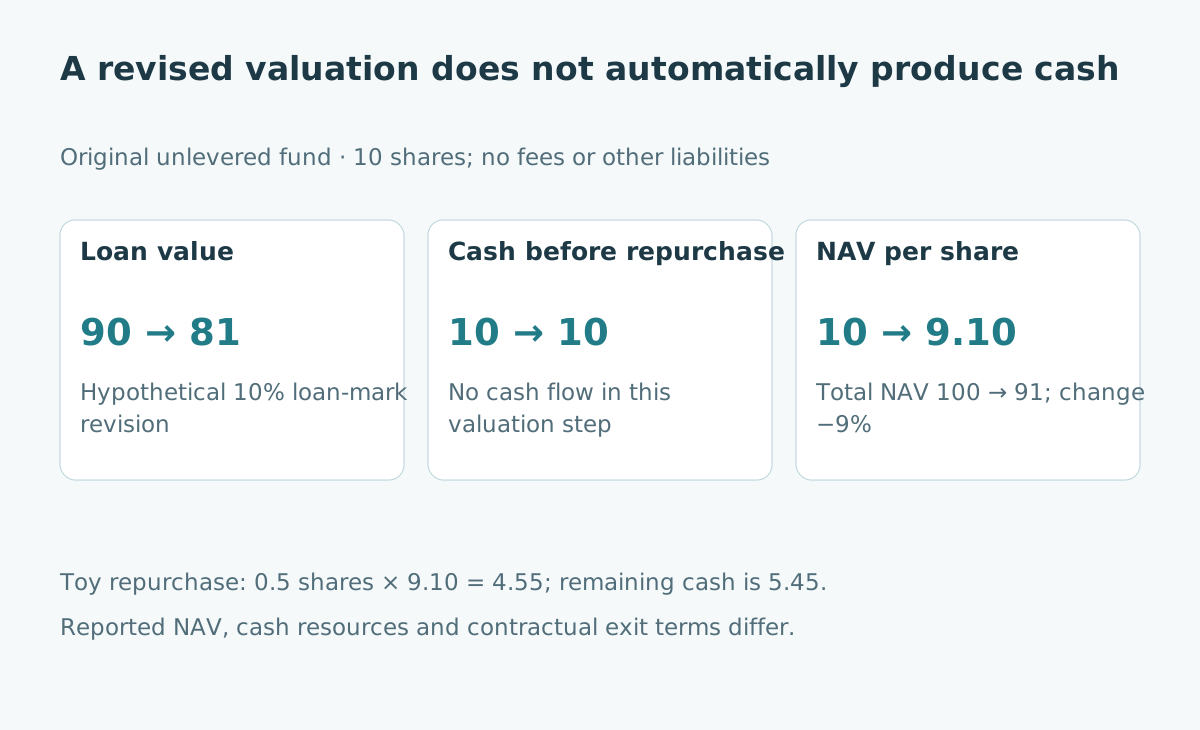
Imagine a fictional unlevered fund with ten shares. It holds loans assigned a value of 90 monetary units and cash of 10. There are no other assets, liabilities or accrued fees in the example. Total NAV is 100, or 10 per share.
Now suppose new information leads to a hypothetical revision of loan value from 90 to 81. Cash remains 10. NAV becomes 91, or 9.10 per share, a 9% decline from 10.
| Simplified balance sheet | Initial assumed value | After hypothetical revision |
|---|---|---|
| Loan assets | 90 | 81 |
| Cash | 10 | 10 |
| Total NAV | 100 | 91 |
| Shares outstanding | 10 | 10 |
| NAV per share | 10.00 | 9.10 |
The loan component declined 10%, while total NAV declined 9% because cash was unchanged. The values do not describe a real loss, a default rate or a forecast.
Do not confuse a flat mark with a stable business
Suppose the same fictional loan mark appeared in several reports before the revision. The chart would show the change at the reporting point when the new mark was recognized. That timing would not reveal exactly when the borrowers' economic prospects changed.
This is a measurement lesson, not an accusation that a manager hid information. A lender might receive new financial statements, amend a loan or update a model. The assessment must use the actual facts and valuation policy.
A smooth series alone cannot distinguish limited economic variation from limited observation. Equally, a sharp revision alone cannot establish misconduct. The useful evidence concerns inputs, methodology, governance and explanations for changes.
Read the repurchase contract separately
Investor.gov's interval-fund explanation describes periodic offers to repurchase a stated portion of shares, with specified acceptance and pricing dates. It distinguishes these arrangements from ordinary exchange trading.
For an original illustration, assume a fictional offer permits repurchasing 0.5 of the ten shares outstanding. Investors collectively request repurchase of one share, and the assumed terms allocate the available amount proportionally. Only half of the requested shares would be accepted under that simplified rule.
This is an invented offer size, not a statement of a universal regulatory requirement. At a hypothetical pricing NAV of 9.10, accepting 0.5 shares requires 4.55 cash. A request for an entire position is different from an assurance that the entire request will be fulfilled.
Track the cash consequence after payment
Continue the example with no other transactions. Before repurchase, cash is 10, loan value is 81 and NAV is 91. Paying 4.55 for 0.5 shares leaves cash of 5.45 and 9.5 shares outstanding.
| Item after the assumed repurchase | Amount |
|---|---|
| Loan value, unchanged in this step | 81 |
| Cash remaining | 5.45 |
| NAV remaining | 86.45 |
| Shares remaining | 9.5 |
| NAV per remaining share | 9.10 |
Payment at the assumed NAV leaves per-share NAV unchanged in this frictionless example. It reduces cash resources. Real funds also face fees, obligations, cash inflows and other portfolio changes, which the illustration excludes.
Ask what happens under a different cash path
NAV and immediately available cash need not move together. A payment from a borrower adds cash but may also reduce a loan balance. A valuation change can alter NAV without generating cash. A credit facility can provide cash while adding debt and financing obligations.
An original review sheet should therefore distinguish interest received, principal received, new lending commitments, fund expenses, borrowing and investor repurchases. Record amounts and timing rather than calling all positive flows “income.”
Then examine a scenario with fewer receipts or more accepted repurchases. Which resources are available, under what conditions, and which obligations remain? This exercise asks about resilience; it does not establish that a fund is distressed or requires an asset sale.
Use the smooth chart as a starting question
Before comparing two products, ask whether their valuation methods, leverage, asset mix and exit terms are comparable. A chart with fewer fluctuations is insufficient evidence that economic risk is lower. A restrictive exit mechanism may fit an illiquid strategy while still being unsuitable for money needed soon.
The BIS paper concerns a driver of market growth, not an endorsement of any product. The numerical examples here show accounting and timing boundaries, not a personalized allocation recommendation. For a related distinction, read profit versus operating cash flow and bond coupon versus market price.
Sources and evidence limits
- BIS Working Paper 1388: Bank liquidity regulation and the growth of private credit, October 20, 2026. Author research; overall systemic-risk effects remain outside scope.
- Federal Reserve: The Rise of Semiliquid Funds for Retail Investors, October 14, 2026. Research context for vehicle differences and valuation questions.
- SEC: Good Faith Determinations of Fair Value—Compliance Guide, checked October 25, 2026.
- Investor.gov: Interval Fund, checked October 25, 2026. Explains periodic repurchase mechanics; actual documents determine the relevant terms.