Global Economy in October 2026: How to Read an IMF Forecast
Interpret the IMF October 2026 growth and inflation forecasts, distinguish projections from outcomes, and build a practical business scenario table.
Updated October 27, 2026 · Economics explainer
Economic forecasts are often presented like weather reports: a number, an arrow and a verdict about whether things are getting better. But a forecast is not a measurement of the future. It is a conditional assessment built from data, assumptions and models that can change when energy prices, trade policy, financial conditions or technology investment shift.
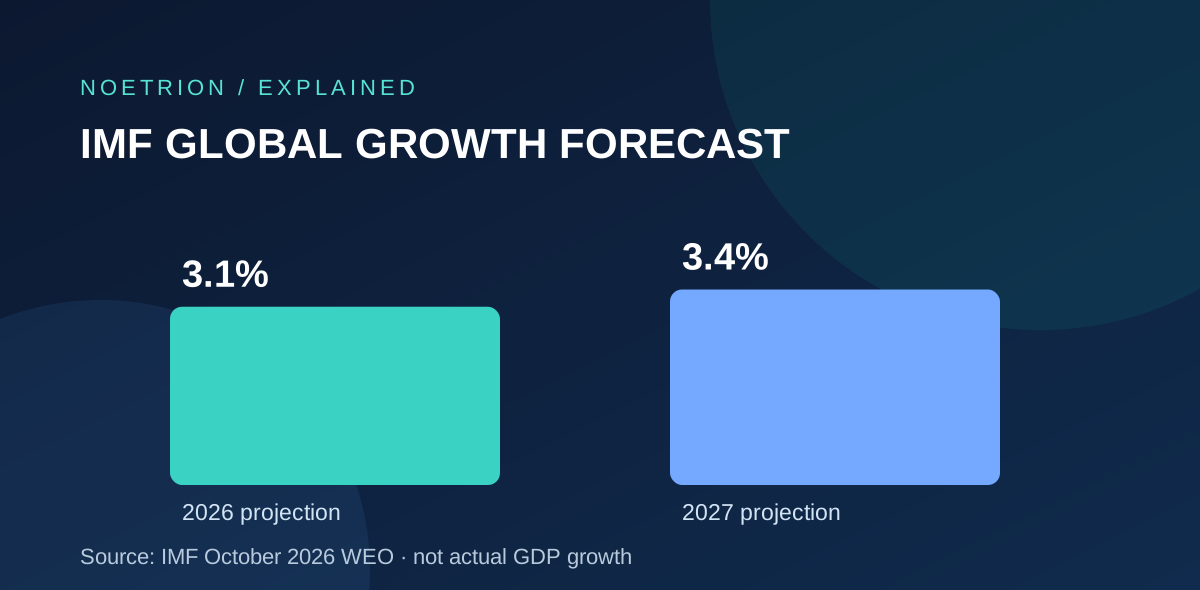
The IMF’s October 13, 2026 World Economic Outlook projects global growth of 3.1% in 2026 and 3.4% in 2027, with global headline inflation of 4.7% and 4.1%, respectively. Its statistical cutoff is October 1, 2026. These are forecasts, not measured full-year outcomes.
Correction, October 27: the original early-morning version used the July forecast because the October headline figures had not yet been verified. The table and chart now use the published October outlook.
Why one global growth number hides several economies
A global average combines countries with different populations, productivity trends, energy exposures and financial conditions. A technology-exporting economy may benefit from data-center and semiconductor investment while an energy-importing economy faces higher costs. A country can post positive GDP growth while many households still feel financially squeezed.
That is why economists look at multiple indicators together: output, employment, real wages, inflation, investment, credit conditions and external balances. Even then, the story differs by industry and household. A small business deciding whether to expand should not treat a global forecast as a substitute for local demand data.
What the October 2026 IMF outlook projects
| Indicator | IMF October 2026 projection | Correct interpretation |
|---|---|---|
| Global growth in 2026 | 3.1% | Forecast, not actual full-year growth |
| Global growth in 2027 | 3.4% | Forecast subject to revision |
| Global headline inflation in 2026 | 4.7% | Global projection, not your household’s inflation rate |
| Global headline inflation in 2027 | 4.1% | Forecast under the report’s assumptions |
The report identifies risks from conflict, trade tensions, financial vulnerabilities, and a reassessment of AI expectations. Those risks motivate a scenario exercise; they do not establish which outcome will occur for a particular business.
The three channels businesses should watch
Energy costs. Higher fuel and electricity prices can raise transportation, production and household expenses. Firms with thin margins may pass some costs to customers, accept lower profits or reduce activity. The effect depends on contracts, competition and how long the shock lasts.
Financing conditions. Interest rates and credit spreads influence borrowing costs, investment and the present value of future cash flows. A company with short-term debt may be more exposed than one with stable long-term financing. Monetary policy can help contain inflation but cannot instantly resolve physical supply disruptions.
Technology investment. AI infrastructure creates demand for chips, construction, power equipment and specialized labor. That can support some sectors even while other parts of the economy slow. However, investment spending is not the same as realized productivity improvement, and capital-intensive projects can fail to meet expected returns.
Build scenarios instead of betting on a single forecast
A useful planning exercise considers a base case, a weaker-demand case and a cost-shock case. For each, identify what would change your decision. A retailer might track monthly sales volume, inventory turnover, supplier prices and cash runway. A software startup might track customer retention, inference cost per task and access to funding.
| Scenario | Illustrative trigger | Possible business response |
|---|---|---|
| Base case | Demand remains near plan | Maintain measured investment |
| Weak demand | Repeat decline in orders | Preserve cash and test pricing |
| Cost shock | Sustained input-cost increase | Review suppliers and margins |
These are decision templates, not predictions that any particular event will occur. The purpose is to reduce the chance of making an irreversible choice based on one headline.
What households and investors can learn
For households, the most actionable questions concern emergency liquidity, income resilience, debt terms and inflation in the items they actually buy. For investors, diversification and fees usually matter more than trying to predict every monthly macroeconomic surprise. A global growth projection should not be translated into a promised portfolio return.
When a new IMF forecast appears, compare it with the previous edition and ask which assumptions changed. Was the revision driven by energy prices, fiscal policy, trade or technology demand? Then separate the macroeconomic implication from the effect on your specific decision.
Use the forecast as a planning input
A forecast is useful when it changes a question you can investigate: which costs are exposed, how much cash a delay would consume, or what customer behavior would justify expansion. Record the assumptions and the trigger for revisiting them. That makes a scenario table a working decision aid rather than a prediction disguised as a plan.
Sources and editorial notes
- IMF, October 2026 World Economic Outlook publication page, published October 13, 2026; headline projections checked October 27, 2026.
Related reading: AI electricity demand and investment costs. Reader action: Write three scenarios for one financial decision rather than relying on a single forecast.